本文主要是介绍《Qt开发》基于QWT的曲线图绘制,希望对大家解决编程问题提供一定的参考价值,需要的开发者们随着小编来一起学习吧!
Qwt绘制曲线图
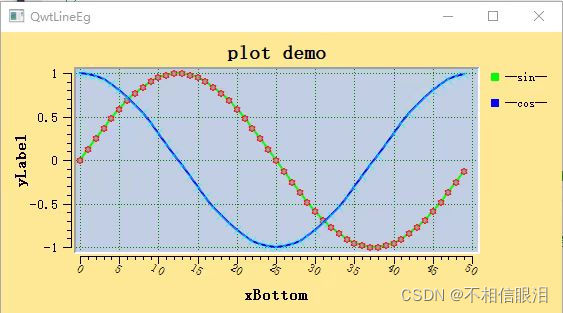
该示例包含以下功能:
1.使用qwt绘制曲线图
2.通过鼠标实现绘图的缩放,只缩放x轴或只缩放y轴或同时缩放
3.设置绘图区域和绘图区域外的背景颜色
4.通过点击图例实现曲线的显示和隐藏
QwtPlot绘图部件
| 头文件 | #include <qwt_plot.h> | |
| 枚举类型 | enum Axis {yLeft, yRight, xBottom, xTop,axisCnt} | 坐标轴 |
| enum LegendPosition { LeftLegend, RightLegend, BottomLegend, TopLegend } | 图例位置 | |
| 常用函数 | QwtPlot (QWidget ∗=NULL) | QwtPlot *plot=newQwtPlot() |
| QwtPlot (const QwtText &title, QWidget ∗=NULL) | QwtPlot *plot=new QwtPlot(QwtText("plot demo")); | |
| void setAutoReplot (bool=true) | 设置自动绘图 | |
| void setTitle (const QString &) | plot->setTitle(“plot demo”); | |
| void setTitle (const QwtText &t) | plot->setTitle(QwtText(“plot demo”)); | |
| void setCanvasBackground (const QBrush &) | plot->setCanvasBackground(Qt::white); | |
| void setAxisAutoScale (int axisId, bool on=true) | plot->setAxisAutoScale(QwtPlot::xBottom, true); | |
| void enableAxis (int axisId, bool tf=true) | plot->setAxisAutoScale(QwtPlot::xBottom, false); | |
| void setAxisFont (int axisId, const QFont &f) | plot->setAxisFont(QwtPlot::xBottom,QFont("宋体")); | |
| void setAxisScale (int axisId, double min, double max, double step=0) | plot->setAxisScale(QwtPlot::xBottom,0,50,5); | |
| void setAxisLabelAlignment (int axisId, Qt::Alignment) | plot->setAxisLabelAlignment(QwtPlot::xBottom, Qt::AlignBaseline | Qt::AlignVCenter); | |
| void setAxisLabelRotation (int axisId, double rotation) | plot->setAxisLabelRotation(QwtPlot::xBottom,30); | |
| void setAxisTitle (int axisId, const QString &) | plot->setAxisTitle(QwtPlot::yLeft,"yLabel"); | |
| void setAxisTitle (int axisId, const QwtText &) | plot->setAxisTitle(QwtPlot::yLeft,QwtText("yLabel")); | |
| void setAxisMaxMinor (int axisId, int maxMinor) | plot->setAxisMaxMinor(QwtPlot::xBottom, 5); 设置每个大格刻度分为几个小格刻度 | |
| void setAxisMaxMajor (int axisId, int maxMajor) | plot->setAxisMaxMajor(QwtPlot::xBottom, 5); 设置xBottom轴有多少个大格 | |
| void insertLegend (QwtAbstractLegend ∗, LegendPosition=QwtPlot::RightLegend, double ratio=-1.0) | QwtLegend *legend = new QwtLegend; legend->setDefaultItemMode(QwtLegendData::Checkable); plot->insertLegend(legend,QwtPlot::RightLegend); |
QwtPlotCurve绘图曲线
| 头文件 | #include <qwt_plot_curve.h> |
| 枚举类型 | enum CurveStyle {NoCurve = -1, Lines, Sticks, Steps,Dots, UserCurve = 100 } |
| enum CurveAttribute { Inverted = 0x01, Fitted = 0x02 } | |
| enum LegendAttribute { LegendNoAttribute = 0x00, LegendShowLine = 0x01, LegendShowSymbol = 0x02, | |
| enum PaintAttribute { ClipPolygons = 0x01, FilterPoints = 0x02, MinimizeMemory = 0x04, ImageBuffer = 0x08} | |
| 常用函数 | QwtPlotCurve (const QString &title=QString::null) |
| void setRawSamples (const double ∗xData, const double ∗yData, int size) | |
| void setSamples (const double ∗xData, const double ∗yData, int size) | |
| void setSamples (const QVector< double > &xData, const QVector< double > &yData) | |
| void setSamples (const QVector< QPointF > &) | |
| void setSamples (QwtSeriesData< QPointF > ∗) | |
| double minXValue () const | |
| double maxXValue () const | |
| double minYValue () const | |
| double maxYValue () const | |
| void setPen (const QColor &, qreal width=0.0, Qt::PenStyle=Qt::SolidLine) | |
| void setPen (const QPen &) | |
| void setBrush (const QBrush &) | |
| void setSymbol (QwtSymbol ∗) | |
| void setStyle (CurveStyle style) |
QwtPlotGrid绘图网格
| 头文件 | #include <qwt_plot_grid.h> |
| 常用函数 | void enableX (bool tf) |
| void enableY (bool tf) | |
| void enableXMin (bool tf) | |
| void enableYMin (bool tf) | |
| void setPen (const QColor &, qreal width=0.0, Qt::PenStyle=Qt::SolidLine) | |
| void setPen (const QPen &) | |
| void setMajorPen (const QColor &, qreal width=0.0, Qt::PenStyle=Qt::SolidLine) | |
| void setMajorPen (const QPen &) | |
| void setMinorPen (const QColor &, qreal width=0.0, Qt::PenStyle=Qt::SolidLine) | |
| void setMinorPen (const QPen &p) |
QwtSymbol绘图标识符
| 头文件 | #include <qwt_symbol.h> |
| 枚举类型 | enum Style {NoSymbol = -1, Ellipse, Rect, Diamond,Triangle, DTriangle, UTriangle, LTriangle,RTriangle, Cross, XCross, HLine,VLine, Star1, Star2, Hexagon,Path, Pixmap, Graphic, SvgDocument,UserStyle = 1000 } |
| enum CachePolicy { NoCache, Cache, AutoCache } | |
| 常用函数 | QwtSymbol (Style=NoSymbol) |
| QwtSymbol (Style, const QBrush &, const QPen &, const QSize &) | |
| QwtSymbol (const QPainterPath &, const QBrush &, const QPen &) | |
| void setSize (const QSize &) | |
| void setSize (int width, int height=-1) | |
| virtual void setColor (const QColor &) | |
| void setBrush (const QBrush &b) | |
| void setPen (const QColor &, qreal width=0.0, Qt::PenStyle=Qt::SolidLine) | |
| void setPen (const QPen &) | |
| void setStyle (Style) |
QwtPlotPicker绘图拾取器,获取坐标信息
QwtPlotPicker能够获取Plot中的以原点为起点的坐标并通过跟随鼠标的Label显示,
| 头文件 | #include <qwt_plot_picker.h> |
| 常用函数 | QwtPlotPicker (int xAxis, int yAxis, QWidget ∗) |
| QwtPlotPicker (int xAxis, int yAxis, RubberBand rubberBand, DisplayMode trackerMode, QWidget ∗) |
QwtPicker
| 头文件 | #include <qwt_picker.h> |
| 枚举类型 | enum RubberBand { |
| enum DisplayMode { AlwaysOff, AlwaysOn, ActiveOnly } | |
| enum ResizeMode { Stretch, KeepSize } | |
| 常用函数 | QwtPicker (QWidget ∗parent) |
| QwtPicker (RubberBand rubberBand, DisplayMode trackerMode, QWidget ∗) | |
| void setStateMachine (QwtPickerMachine ∗) | |
| void setRubberBand (RubberBand) | |
| void setTrackerMode (DisplayMode) | |
| void setRubberBandPen (const QPen &) | |
| void setTrackerPen (const QPen &) | |
| void setTrackerFont (const QFont &) |
更多详情查看用户手册。
示例程序
头文件内容如下:
#ifndef QWTLINEEG_H
#define QWTLINEEG_H
#include <QtWidgets/QWidget>
#include "ui_qwtlineeg.h"
#include "QWT\qwt_plot.h"
#include "QWT\qwt_plot_grid.h"
#include "QWT\qwt_plot_curve.h"
#include "QWT\qwt_plot_picker.h"
#include "QWT\qwt_picker_machine.h"
#include "qmath.h"
#include "QWT\qwt_symbol.h"
#include "QWT\qwt_plot_magnifier.h"
#include "QWT\qwt_plot_panner.h"
#include "QWT\qwt_legend.h"
#include "QWT\qwt_plot_zoomer.h"
#include "QWT\qwt_text.h"
class QwtLineEg : public QWidget
{
Q_OBJECT
public:
QwtLineEg(QWidget *parent = 0);
~QwtLineEg();
private:
Ui::QwtLineEgClass ui;
QwtPlot *plot;
void DrawLine(); //绘制曲线
void ZoomInOut(); //缩放
public slots:
void showItem(const QVariant &itemInfo, bool on);
};
#endif // QWTLINEEG_H
源文件内容如下:
#include "qwtlineeg.h"
QwtLineEg::QwtLineEg(QWidget *parent)
: QWidget(parent)
{
ui.setupUi(this);
DrawLine();
ZoomInOut();
}
QwtLineEg::~QwtLineEg()
{
}
void QwtLineEg::DrawLine()
{
//设置绘图对象
plot = new QwtPlot(QwtText("plot demo"));
//plot->setTitle("plot demo");
plot->setCanvasBackground(QColor(255,255,255)); //设置绘图区域的颜色
plot->setAutoReplot(true);
QPalette pal = palette();
pal.setBrush(QPalette::Window, QColor(255, 231, 147)); //设置整个界面的颜色
setPalette(pal);
//设置坐标轴
plot->setAxisTitle(QwtPlot::yLeft,"yLabel");
plot->setAxisTitle(QwtPlot::xBottom,"xBottom");
plot->setAxisFont(QwtPlot::xBottom,QFont("宋体"));
plot->setAxisScale(QwtPlot::xBottom,0,50,5);
plot->setAxisLabelAlignment(QwtPlot::xBottom, Qt::AlignBaseline | Qt::AlignVCenter);
plot->setAxisLabelRotation(QwtPlot::xBottom,30);
//设置绘图区域网格
QwtPlotGrid *grid = new QwtPlotGrid();
grid->setMajorPen(Qt::darkGreen, 0, Qt::DotLine);
grid->attach(plot);
//设置图例
QwtLegend *legend = new QwtLegend;
legend->setDefaultItemMode(QwtLegendData::Checkable);
plot->insertLegend(legend,QwtPlot::RightLegend);
connect(legend, SIGNAL(checked(const QVariant &,bool,int)), SLOT(showItem(const QVariant &,bool)));
//设置曲线对象
QwtPlotCurve *curve = new QwtPlotCurve();
curve->setTitle("--sin--");
curve->setPen(Qt::green, 2);
curve->setRenderHint(QwtPlotItem::RenderAntialiased, true);
QwtPlotCurve *curve2 = new QwtPlotCurve();
curve2->setTitle("--cos--");
curve2->setPen(Qt::blue, 2);
curve2->setRenderHint(QwtPlotItem::RenderAntialiased, true);
//准备符号对象
QwtSymbol *symbol = new QwtSymbol(QwtSymbol::Star2);
symbol->setPen(Qt::red);
symbol->setSize(7);
curve->setSymbol(symbol);
QwtSymbol *symbol2 = new QwtSymbol(QwtSymbol::XCross);
symbol2->setPen(Qt::cyan);
symbol2->setSize(7);
curve2->setSymbol(symbol2);
//生成数据点并添加到曲线
QPolygonF points,points2;
for (int i = 0; i < 50; i++)
{
double y = sin(i * 2 * M_PI / 50);
points.append(QPointF(i,y));
y = cos(i * 2 * M_PI / 50);
points2.append(QPointF(i, y));
}
curve->setSamples(points);
curve->attach(plot); //将曲线添加到绘图对象
curve2->setSamples(points2);
curve2->attach(plot); //将曲线添加到绘图对象
//显示鼠标位置
QwtPlotPicker *picker = new QwtPlotPicker(QwtPlot::xBottom, QwtPlot::yLeft,
QwtPlotPicker::CrossRubberBand, QwtPicker::AlwaysOn, plot->canvas());
picker->setStateMachine(new QwtPickerDragPointMachine());
picker->setRubberBandPen(QColor(Qt::green));
picker->setTrackerPen(QColor(Qt::red));
//设置绘图区域布局
QHBoxLayout *hLayout = new QHBoxLayout(ui.widget);
hLayout->setContentsMargins(QMargins(0, 0, 0, 0));
hLayout->setMargin(0);
hLayout->addWidget(plot);
}
void QwtLineEg::ZoomInOut()
{
//鼠标控制平移和缩放
QwtPlotMagnifier *magnifier = new QwtPlotMagnifier(plot->canvas()); //使用滚轮缩放
QwtPanner *panner = new QwtPlotPanner(plot->canvas()); //使用鼠标左键平移
//Shift+滚轮,X轴缩放
QwtPlotMagnifier *zoomX = new QwtPlotMagnifier(plot->canvas());
QwtPlotMagnifier *zoomY = new QwtPlotMagnifier(plot->canvas());
zoomX->setWheelModifiers(Qt::ShiftModifier);
zoomX->setAxisEnabled(QwtPlot::xBottom, true);
zoomX->setAxisEnabled(QwtPlot::yLeft, false);
//Ctrl+滚轮,Y轴缩放
zoomY->setWheelModifiers(Qt::ControlModifier);
zoomY->setAxisEnabled(QwtPlot::xBottom, false);
zoomY->setAxisEnabled(QwtPlot::yLeft, true);
}
void QwtLineEg::showItem(const QVariant &itemInfo, bool on)
{
//获取曲线
QwtPlotItem *plotItem = plot->infoToItem(itemInfo);
//根据曲线选择状态,设置曲线隐藏和显示,选中隐藏
if (plotItem)
plotItem->setVisible(!on);
plot->replot();
}
运行结果如下,鼠标点击图例可以实现曲线显示和隐藏的切换
这篇关于《Qt开发》基于QWT的曲线图绘制的文章就介绍到这儿,希望我们推荐的文章对编程师们有所帮助!


