本文主要是介绍Prometheus结合Grafana监控MySQL,这篇不可不读!,希望对大家解决编程问题提供一定的参考价值,需要的开发者们随着小编来一起学习吧!
📢📢📢📣📣📣
哈喽!大家好,我是【IT邦德】,江湖人称jeames007,10余年DBA及大数据工作经验
一位上进心十足的【大数据领域博主】!😜😜😜
中国DBA联盟(ACDU)成员,目前服务于工业互联网
擅长主流Oracle、MySQL、PG、高斯及Greenplum运维开发,备份恢复,安装迁移,性能优化、故障应急处理等。
✨ 如果有对【数据库】感兴趣的【小可爱】,欢迎关注【IT邦德】💞💞💞
❤️❤️❤️感谢各位大可爱小可爱!❤️❤️❤️
文章目录
- 📣 1.Prometheus介绍
- 📣 2.安装Prometheus
- 📣 3.监控MySQL
- ✨ 3.1 下载安装包
- ✨ 3.2 解压安装
- ✨ 3.3 添加数据源
- ✨ 3.4 自启动设置
- ✨ 3.5 添加监控目标
- 📣 4.告警alertmanager
- ✨ 4.1 部署alertmanager
- ✨ 4.2 开机自启
- ✨ 4.3 集成alertmanager
- ✨ 4.4 创建报警规则
- 📣 5.总结
监控系统俗称「第三只眼」,几乎是我们每天都会打交道的系统,本文基于Prometheus结合Grafana监控MySQL,分享给大家
📣 1.Prometheus介绍
Prometheus(由go语言(golang)开发)是一套开源的监控&报警&时间序列数据库的组合。适合监控docker容器。因为kubernetes(俗称k8s)的流行带动了prometheus的发展。
Prometheus提供了从指标暴露,到指标抓取、存储和可视化,以及最后的监控告警等组件。
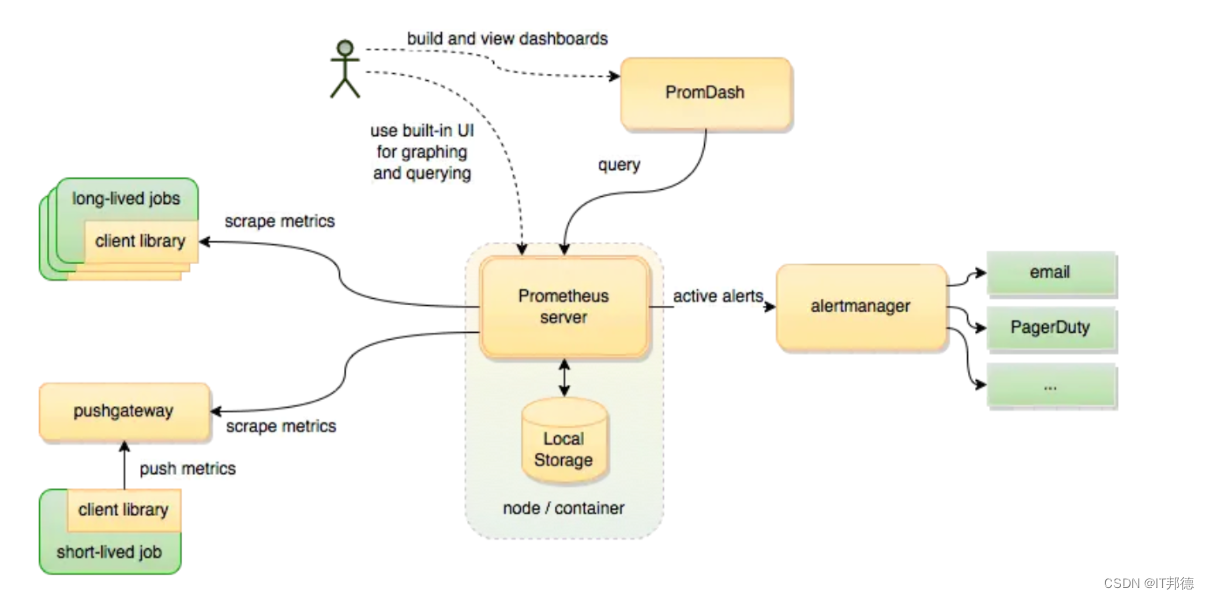
从上图可发现,Prometheus整个生态圈组成主要包括prometheus server,Exporter,pushgateway,alertmanager,grafana,Web ui界面,Prometheus server由三个部分组成,Retrieval,Storage,PromQL
1.Retrieval负责在活跃的target主机上抓取监控指标数据
2.Storage存储主要是把采集到的数据存储到磁盘中
3.PromQL是Prometheus提供的查询语言模块。
📣 2.安装Prometheus
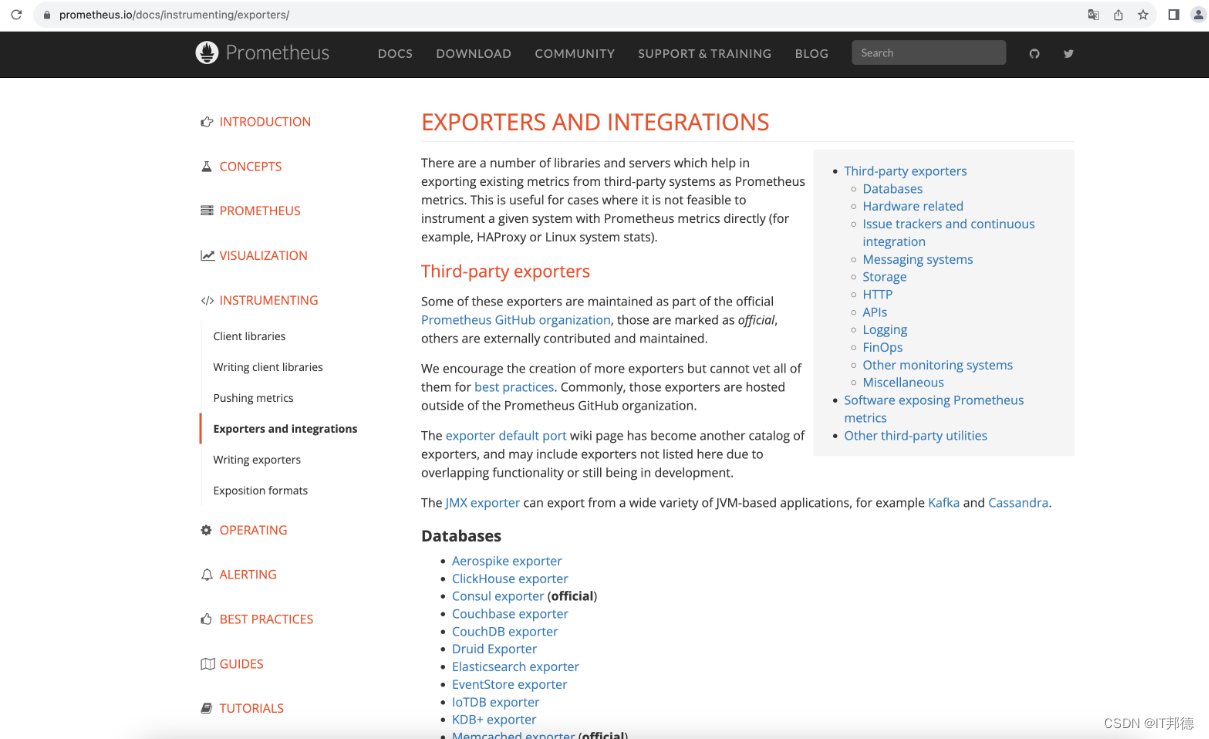
监控组件下载地址
https://prometheus.io/docs/instrumenting/exporters/
tar -zxvf prometheus-2.45.3.linux-amd64.tar.gz -C /usr/local/
ln -s /usr/local/prometheus-2.45.3.linux-amd64 /usr/local/prometheus
ln -s /usr/local/prometheus/prometheus /usr/local/bin/prometheusprometheus --config.file=/usr/local/prometheus/prometheus.yml \
--storage.tsdb.path=/usr/local/prometheus/data/ \
--web.enable-lifecycle \
--storage.tsdb.retention.time=15d &
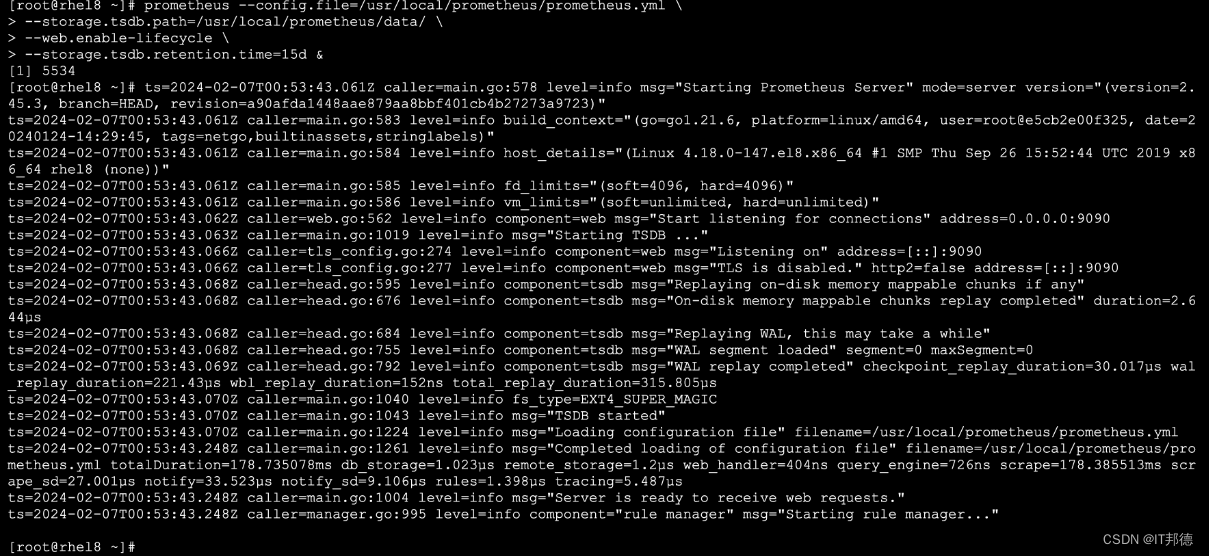
lsof -i:9090
ps -ef|grep prometheus
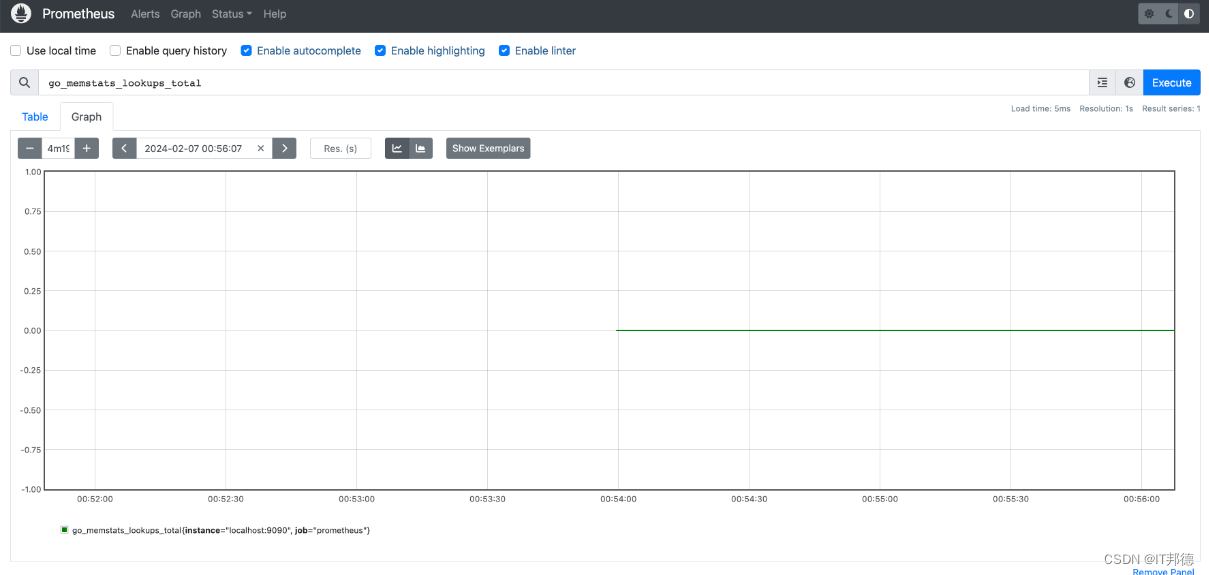
http://192.168.3.10:9090
📣 3.监控MySQL
✨ 3.1 下载安装包
https://prometheus.io/download/
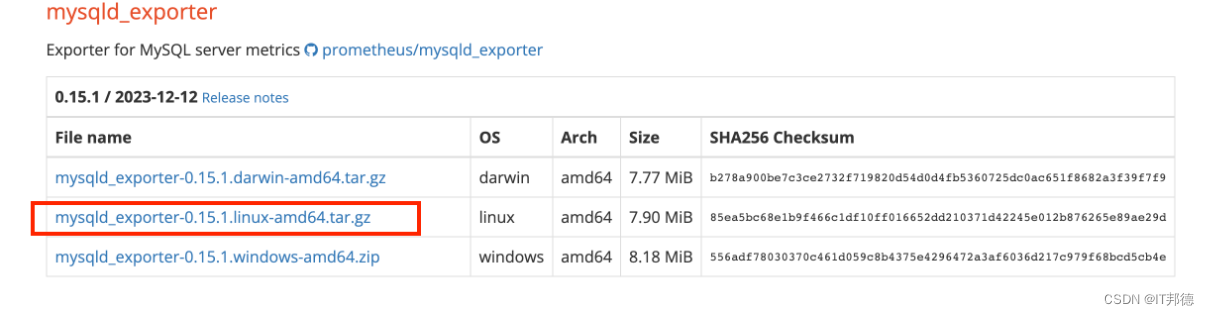
✨ 3.2 解压安装
tar -zxvf mysqld_exporter-0.15.1.linux-amd64.tar.gz
mv ./mysqld_exporter-0.15.1.linux-amd64/mysqld_exporter /usr/local/bin/
✨ 3.3 添加数据源
创建监控用户
mysql> create user mysql_exporter@‘%’ identified with mysql_native_password by ‘root’;
mysql> grant process, replication client, select on . to ‘mysql_exporter’@‘%’;
mysql> flush privileges;
配置MySQL密码
mkdir -p /etc/mysql_exporter
cd /etc/mysql_exporter
cat > mysql3306_192168312.cnf << “EOF”
[client]
host=192.168.3.12
user=mysql_exporter
password=root
port=3306
EOF
✨ 3.4 自启动设置
cat > /usr/lib/systemd/system/mysqld_exporter.service <<EOF
[Unit]
Description=mysql_exporter
After=network.target[Service]
Type=simple
User=root
ExecStart=/usr/local/bin/mysqld_exporter --config.my-cnf="/etc/mysql_exporter/mysql3306_192168312.cnf" --web.listen-address=":9104"
Restart=on-failure[Install]
WantedBy=multi-user.target
EOF# 通知systemd重新加载配置文件
systemctl daemon-reload
#启动
systemctl start mysqld_exporter
#设置开机自启动
systemctl enable mysqld_exporter
#查看状态
systemctl status mysqld_exporter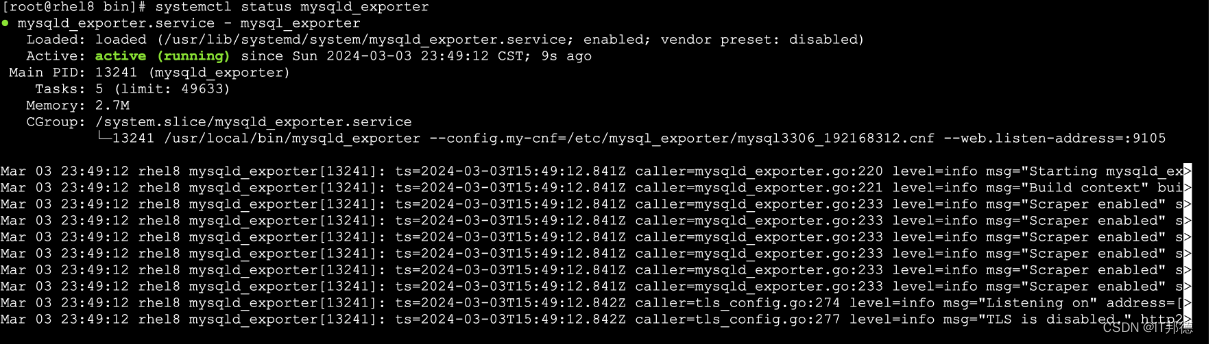
✨ 3.5 添加监控目标
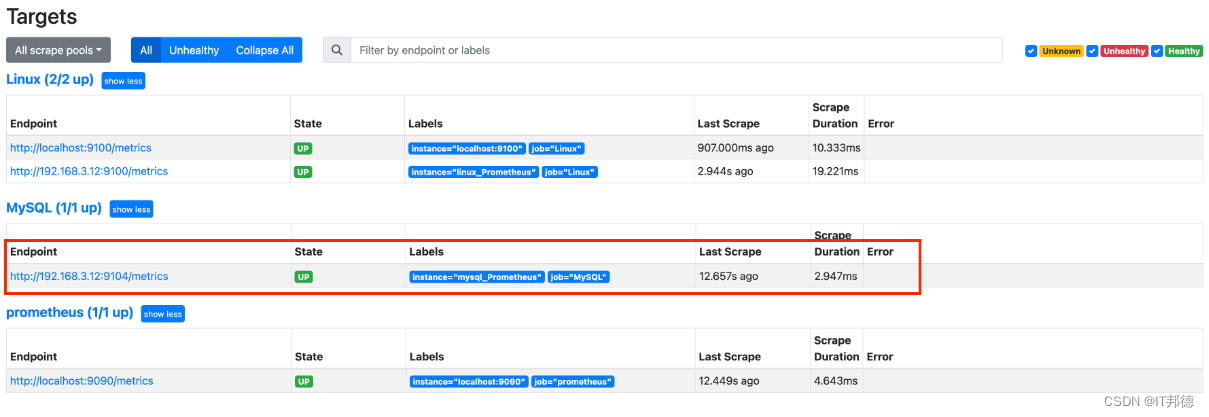
vi /usr/local/prometheus/prometheus.yml- job_name: 'MySQL'static_configs:- targets: ['192.168.3.12:9104']labels:instance: mysql_Prometheussystemctl restart prometheus
systemctl status prometheushttp://192.168.3.10:9090/targets?search=
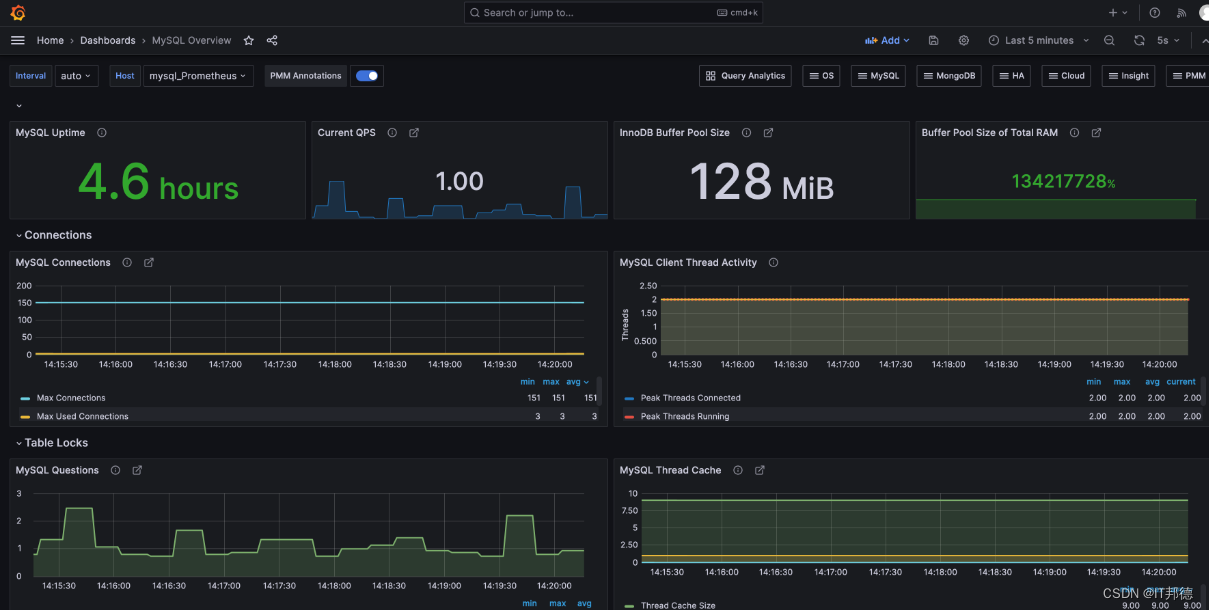
在Grafana官网中找到mysql的监控模板 Mysql Overview,ID为7362,使用ID的方式导入到Grafana中去
📣 4.告警alertmanager
在Prometheus的报警系统中,是分为2个部分的, 规则是配置是在prometheus中的, prometheus组件完成报警推送给alertmanager的, alertmanager然后管理这些报警信息,包括静默、抑制、聚合和通过电子邮件、on-call通知系统和聊天平台等方法发送通知。
主要步骤如下,安装在Prometheus服务器即可
安装和部署alertmanager
在prometheus中配置alertmanager的地址信息。
在prometheus中设置报警规则
在alertmanager配置接受者信息等
✨ 4.1 部署alertmanager
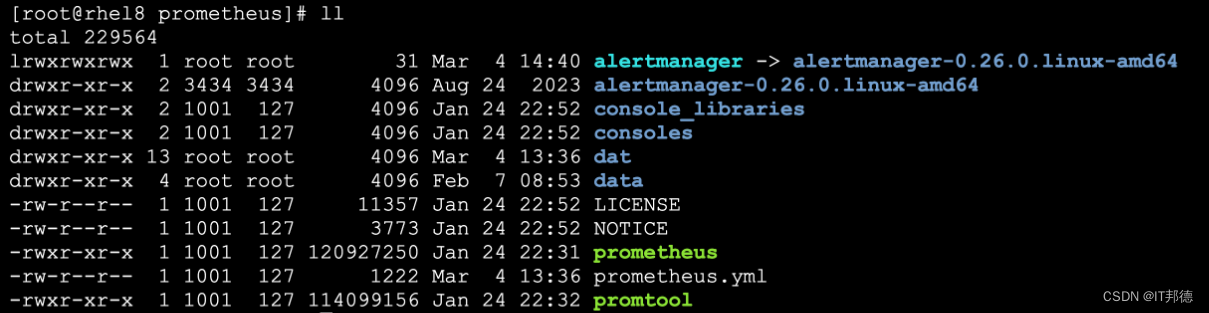
tar xf alertmanager-0.26.0.linux-amd64.tar.gz
mv alertmanager-0.26.0.linux-amd64 /usr/local/prometheus/
cd /usr/local/prometheus/
ln -s alertmanager-0.26.0.linux-amd64 alertmanager
✨ 4.2 开机自启
vi /usr/lib/systemd/system/alertmanager.service[Unit]
Description=alertmanager
After=network.target[Service]
User=root
Group=root
WorkingDirectory=/usr/local/prometheus/alertmanager
ExecStart=/usr/local/prometheus/alertmanager/alertmanager  --log.level=debug --log.format=json
[Install]
WantedBy=multi-user.target# 通知systemd重新加载配置文件,记得重启服务器即可
systemctl daemon-reload
#启动
systemctl restart alertmanager
systemctl status alertmanager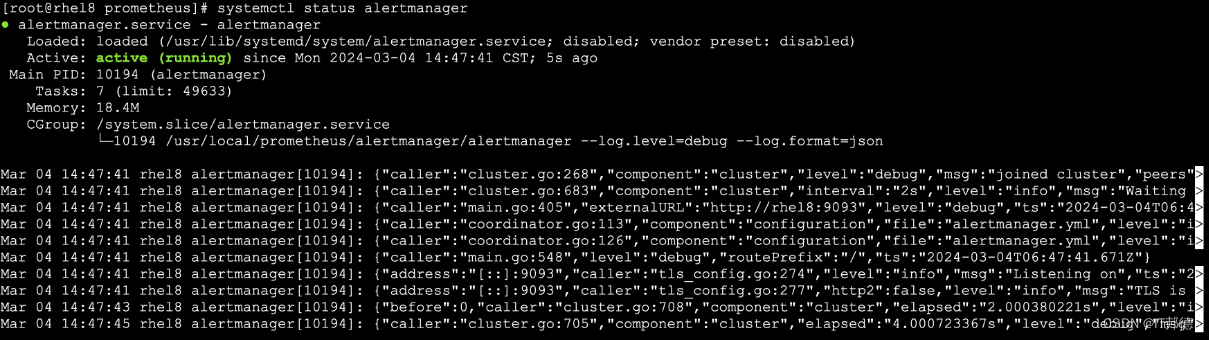
✨ 4.3 集成alertmanager
部署完毕alertmanager, 需要告知prometheus告警信息推送的位置, 通过如下配置即可完成。相对比较简单。
vi /usr/local/prometheus/prometheus.yml
# 修改此文件中的alerting的配置如下配置
alerting:alertmanagers:- static_configs:- targets:- 192.168.3.12:9093配置完毕后重启prometheus服务。
systemctl restart prometheus
✨ 4.4 创建报警规则
为了能先走通流程,这里的报警规则先弄一个简单一点的。
vi prometheus.yml
rule_files:- "rules/*rules.yml"# - "second_rules.yml"
cd /usr/local/prometheus/
mkdir rules
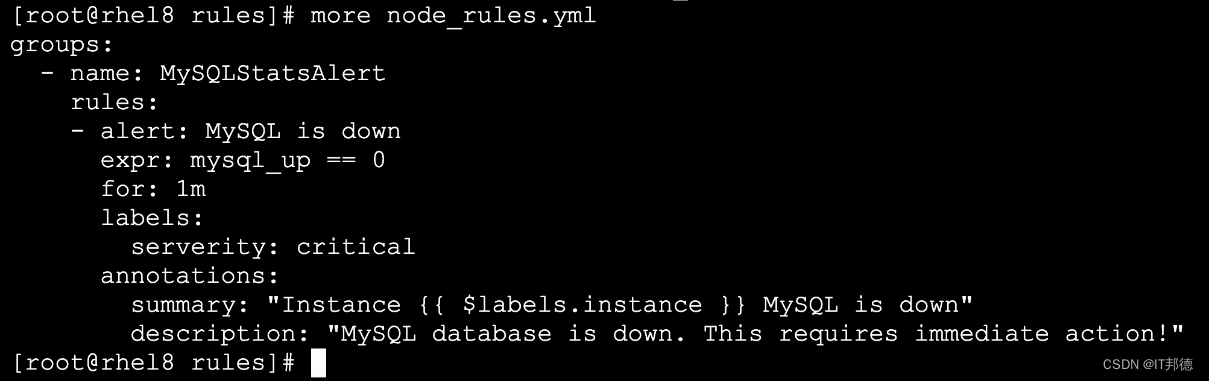
vi node_rules.yml
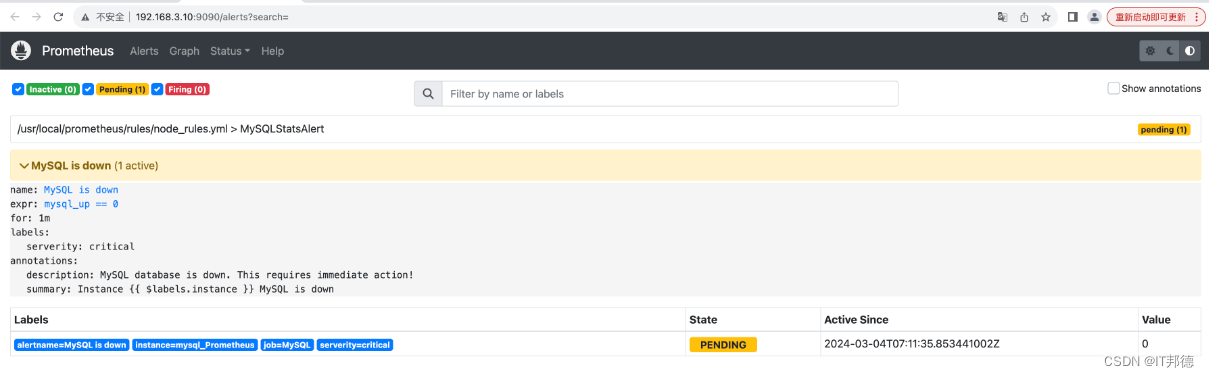
重启prometheus服务,可以在web界面看到如下信息
groups:- name: MySQLStatsAlertrules:- alert: MySQL is downexpr: mysql_up == 0for: 1mlabels:serverity: criticalannotations:summary: "Instance {{ $labels.instance }} MySQL is down"description: "MySQL database is down. This requires immediate action!"
http://192.168.3.10:9090/alerts?search=
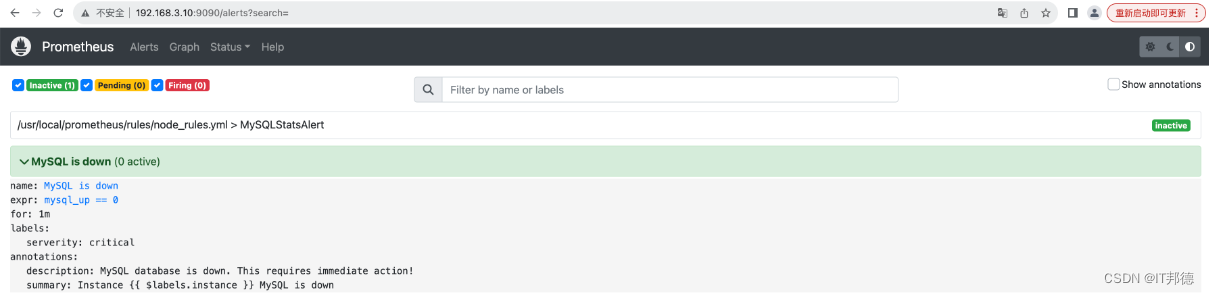
此时我们关闭 告警,发现监控显示MySQL已经关闭了
📣 5.总结
由于篇幅问题,本文的内容并未涉及到全链路监控、日志监控、以及Web前端和客户端的监控,可见监控真的是一个庞大且复杂的体系,如果想理解透彻,必须理论结合实践再做深入。
这篇关于Prometheus结合Grafana监控MySQL,这篇不可不读!的文章就介绍到这儿,希望我们推荐的文章对编程师们有所帮助!


