2019独角兽企业重金招聘Python工程师标准>>> 
1: Our Dataset
In the last mission, we used a dataset on US income, which we'll keep using here. The data is from the 1994 Census, and contains information on an individual's marital status, age, type of work, and more. The target column, high_income, is if they make less than or equal to 50k a year (0), or more than 50k a year (1).
You can download the data from here.
2: ID3 Algorithm
In the last mission, we learned about the basics of decision trees, including entropy and information gain. In this mission, we'll build on those concepts to construct a full decision tree in Python and make predictions.
In order to do this, we'll use the ID3 Algorithm![]() for constructing decision trees. This algorithm involves recursion. If you're unfamiliar with recursion, we suggest trying this mission first. We also suggest learning about lambda functions here if you aren't familiar.
for constructing decision trees. This algorithm involves recursion. If you're unfamiliar with recursion, we suggest trying this mission first. We also suggest learning about lambda functions here if you aren't familiar.
In general, recursion is the process of splitting a large problem into small chunks. Recursive functions will call themselves, then combine the results to create a final result.
Building trees is a perfect case for a recursive algorithm -- at each node, we'll call a recursive function, which will split the data into two branches. Each branch will lead to a node, and the function will call itself to build out the tree.
Below is the full ID3 Algorithm, in pseudocode. Pseudocode is a version of code in plain text, where concepts are explained. It's a good way to understand an algorithm before trying to code it.
def id3(data, target, columns)
1 Create a node for the tree
2 If all values of the target attribute are 1, Return the node, with label = 1.
3 If all values of the target attribute are 0, Return the node, with label = 0.
4 Using information gain, find A, the column that splits the data best
5 Find the median value in column A
6 Split A into values below or equal to the median (0), and values above the median (1)
7 For each possible value (0 or 1), vi, of A,
8 Add a new tree branch below Root, corresponding to the rows in the data where A = vi.
9 Let Examples(vi) be the subset of examples that have the value vi for A
10 Below this new branch add the subtree id3(data[A==vi], target, columns)
11 Return Root
We've made a minor modification to the algorithm to only make two branches from each node. This will simplify constructing the tree, and make it easier to demonstrate the principles involved.
The recursive nature of the algorithm comes into play on line 10. Every node in the tree will call the id3 function, and the final tree will be the result of all of these calls.
3: Algorithm Example
To make ID3 easier to follow, let's work through an example. An example dataset is below. We want to predict high_income using ageand marital_status. In the marital_status column, 0 means unmarried, 1 means married, and 2 means divorced.
high_income age marital_status
0 20 0
0 60 2
0 40 1
1 25 1
1 35 2
1 55 1
We first start with our algorithm: We have both 0s and 1s in high_income, so we skip lines 2 and 3. We jump to line 4. We won't go through the information gain calculations here, but the column we split on is age.
We're on line 5 -- we find the median, which is 37.5.
Per line 6, we make everything less than or equal to the median 0, and anything greater than the median 1. We now get into the loop on line 7. Since we're going through possible values of A in order, we hit the 0 values first. We'd make a branch going to the left with rows in the data where age <= 37.5.
We hit line 10, and call id3 on the new node at the end of that branch. We "pause" this current execution of id3 because we called the function again. We'll call this paused state Node 1. Nodes are numbered in the bottom right corner.
Node2Ageabove37.5?1No(3rows)Newnode2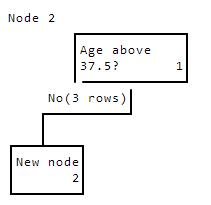
The new node has the following data:
high_income age marital_status
0 20 0
1 25 1
1 35 2
Since we recursively called the id3 function on line 10, we start over at the top, with only the data post-split. We skip lines 2 and 3again, and find another variable to split on. age is again the best split variable, with a median of 25. We make a branch to the left whereage <= 25.
Node3Ageabove37.5?1No(3rows)Ageabove25?2N(2)NewNode3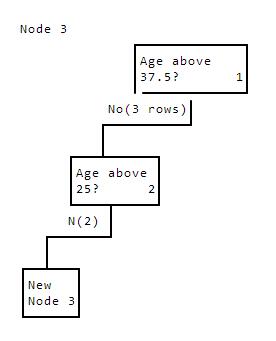
The new node has the following data:
high_income age marital_status
0 20 0
1 25 1
We'll again hit line 10, and "pause" node 2, to start over in the id3 function. We find that the best column to split on is again age, and the median is 22.5.
We perform another split:
Node4Ageabove37.5?1No(3rows)Ageabove25?2N(2)Ageabove22.5?3N(1)Leaf(0)4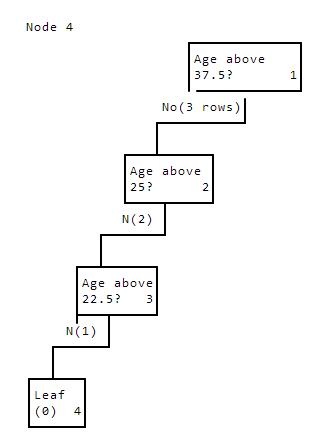
All the values for high_income in node 4 are 0. This means that line 3 applies, and we don't keep building the tree lower. This causes the id3 function for node 4 to return. This "unpauses" the id3 function for node 3, which then moves on to building the right side of the tree. Line 7 specifies that we're in a for loop. When the id3 algorithm for node 4 returns, node 3 goes to the next iteration in the for loop, which is the right branch.
We're now on node 5, which is the right side of the split we make from node 3. This calls the id3 function for node 5. This stops at line2 and returns. There's only one row in this split, and we again end up with a leaf node, where the label is 1.
Node5Ageabove37.5?1No(3rows)Ageabove25?2N(2)Ageabove22.5?3N(1)Yes(1)Leaf(0)Leaf(1)45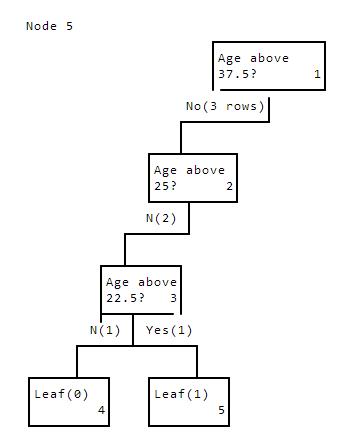
We're done with the entire loop for node 3. We've constructed a lefthand subtree, and a righthand subtree (both end in leaves all the way down).
The id3 function for node 3 now hits line 11 and returns. This "unpauses" node 2, where we construct the right split. There's only one row here, the 35 year old. This again creates a leaf node, with the label 1.
Node6Ageabove37.5?1No(3rows)Ageabove25?2N(2)Yes(1)AgeaboveLeaf(1)22.5?36N(1)Yes(1)Leaf(0)Leaf(1)45
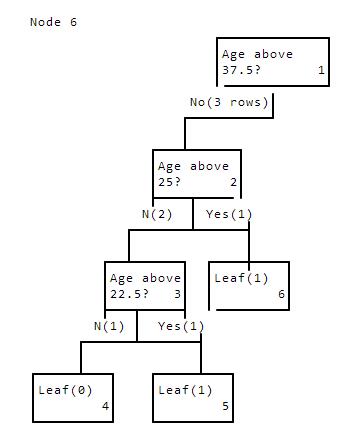
This causes node 2 to finish processing and return on line 11. This causes node 1 to "unpause" and start building the right side of the tree.
We won't build out the whole right side of the tree right now, and we'll dive into code to construct trees automatically.
4: Column Split Selection
In the last mission, we wrote functions to calculate entropy and information gain. These functions have been loaded in as calc_entropyand calc_information_gain.
We now need a function to return the name of the column to split a dataset on. The function should take the dataset, the target column, and a list of columns we might want to split on as input.
Instructions
-
Write a function called
find_best_columnthat returns the name of a column to split the data on. We've started to define this function for you. -
Use
find_best_columnto find the best column to splitincomeon.- The target is the
high_incomecolumn, and the potential columns to split with are in the listcolumnsbelow. - Assign the result to
income_split.
- The target is the
def find_best_column(data, target_name, columns):
# Fill in the logic here to automatically find the column in columns to split on.
# data is a dataframe.
# target_name is the name of the target variable.
# columns is a list of potential columns to split on.
return None
# A list of columns to potentially split income with.
columns = ["age", "workclass", "education_num", "marital_status", "occupation", "relationship", "race", "sex", "hours_per_week", "native_country"]
def find_best_column(data, target_name, columns):
information_gains = []
# Loop through and compute information gains.
for col in columns:
information_gain = calc_information_gain(data, col, "high_income")
information_gains.append(information_gain)
# Find the name of the column with the highest gain.
highest_gain_index = information_gains.index(max(information_gains))
highest_gain = columns[highest_gain_index]
return highest_gain
income_split = find_best_column(income, "high_income", columns)
5: Creating A Simple Recursive Algorithm
To build up to making the full id3 function, let's first build a simpler algorithm that we can extend. Here's that algorithm in pseudocode:
def id3(data, target, columns)
1 Create a node for the tree
2 If all values of the target attribute are 1, add 1 to counter_1.
3 If all values of the target attribute are 0, add 1 to counter_0.
4 Using information gain, find A, the column that splits the data best
5 Find the median value in column A
6 Split A into values below or equal to the median (0), and values above the median (1)
7 For each possible value (0 or 1), vi, of A,
8 Add a new tree branch below Root, corresponding to the rows in the data where A = vi.
9 Let Examples(vi) be the subset of examples that have the value vi for A
10 Below this new branch add the subtree id3(data[A==vi], target, columns)
11 Return Root
This version is very similar to the algorithm above, but lines 2 and 3 are different. Instead of storing the whole tree (which is a bit complicated), we'll just count up how many leaves end up with the label 1, and how many end up with the label 0.
We'll replicate this algorithm in code, and apply it to the same dataset we stepped through above:
high_income age marital_status
0 20 0
0 60 2
0 40 1
1 25 1
1 35 2
1 55 1
Instructions
Read the id3 function below and fill in the lines that have "Insert code here...".
- This function should append
1tolabel_1sif the node should be a leaf, and only has 1s forhigh_income. - It should append
0tolabel_0sif the node should be a leaf, and only has 0s forhigh_income
# We'll use lists to store our labels for nodes (when we find them).
# Lists can be accessed inside our recursive function, whereas integers can't.
# Look at the python missions on scoping for more information on this.
label_1s = []
label_0s = []
def id3(data, target, columns):
# The pandas.unique method will return a list of all the unique values in a Series.
unique_targets = pandas.unique(data[target])
if len(unique_targets) == 1:
# Insert code here to append 1 to label_1s or 0 to label_0s based on what we should label the node.
# See lines 2 and 3 in the algorithm.
# Returning here is critical -- if we don't, the recursive tree will never finish, and run forever.
# See our example above for when we returned.
return
# Find the best column to split on in our data.
best_column = find_best_column(data, target, columns)
# Find the median of the column.
column_median = data[best_column].median()
# Create the two splits.
left_split = data[data[best_column] <= column_median]
right_split = data[data[best_column] > column_median]
# Loop through the splits and call id3 recursively.
for split in [left_split, right_split]:
# Call id3 recursively to process each branch.
id3(split, target, columns)
# Create the dataset that we used in the example in the last screen.
data = pandas.DataFrame([
[0,20,0],
[0,60,2],
[0,40,1],
[1,25,1],
[1,35,2],
[1,55,1]
])
# Assign column names to the data.
data.columns = ["high_income", "age", "marital_status"]
# Call the function on our data to set the counters properly.
id3(data, "high_income", ["age", "marital_status"])
label_1s = []
label_0s = []
def id3(data, target, columns):
unique_targets = pandas.unique(data[target])
if len(unique_targets) == 1:
if 0 in unique_targets:
label_0s.append(0)
elif 1 in unique_targets:
label_1s.append(1)
return
best_column = find_best_column(data, target, columns)
column_median = data[best_column].median()
left_split = data[data[best_column] <= column_median]
right_split = data[data[best_column] > column_median]
for split in [left_split, right_split]:
id3(split, target, columns)
id3(data, "high_income", ["age", "marital_status"])
6: Storing The Tree
We can now store the entire tree instead of just the labels at the leaves. In order to do this, we'll use nested dictionaries. We can represent the root node with a dictionary, and branches as the keys left and right. We can store the column we're splitting on as the keycolumn, and the median value as the key median. Finally, we can store the label for a leaf as the key label. We'll also number each node as we go along, using the number key.
We'll use the same dataset we've been looking at:
high_income age marital_status
0 20 0
0 60 2
0 40 1
1 25 1
1 35 2
1 55 1
Here's the dictionary for a decision tree created on the above data:
{ "left":{ "left":{ "left":{ "number":4,
"label":0
},
"column":"age",
"median":22.5,
"number":3,
"right":{ "number":5,
"label":1
}
},
"column":"age",
"median":25.0,
"number":2,
"right":{ "number":6,
"label":1
}
},
"column":"age",
"median":37.5,
"number":1,
"right":{ "left":{ "left":{ "number":9,
"label":0
},
"column":"age",
"median":47.5,
"number":8,
"right":{ "number":10,
"label":1
}
},
"column":"age",
"median":55.0,
"number":7,
"right":{ "number":11,
"label":0
}
}
}
If we look at node 2 (the left split of the root node), we see that it matches the hand exercise we did a few screens ago. Node 2 splits, and the right branch (node 6) has a label 1, whereas the left branch (node 3) splits again.
In order to keep track of the tree, we'll need to make some modifications to id3. The first is that we'll be changing the definition to pass in the tree dictionary:
def id3(data, target, columns, tree)
1 Create a node for the tree
2 Number the node
3 If all values of the target attribute are 1, assign 1 to the label key in tree.
4 If all values of the target attribute are 0, assign 0 to the label key in tree.
5 Using information gain, find A, the column that splits the data best
6 Find the median value in column A
7 Assign the column and median keys in tree
8 Split A into values below or equal to the median (0), and values above the median (1)
9 For each possible value (0 or 1), vi, of A,
10 Add a new tree branch below Root, corresponding to the rows in the data where A = vi.
11 Let Examples(vi) be the subset of examples that have the value vi for A
12 Create a new key with the name corresponding to the side of the split (0=left, 1=right). The value of this key should be an empty dictionary.
13 Below this new branch add the subtree id3(data[A==vi], target, columns, tree[split_side])
14 Return Root
The main difference is that we're now passing the tree dictionary into our id3 function, and setting some keys on it. One complexity is in how we're creating the nested dictionary. For the left split, we're adding a key to the tree dictionary that looks like: tree["left"] = {}. For the right side, we're doing tree["right"] = {}. After we add this key, we're able to pass the newly created dictionary into the recursive call to id3. This new dictionary will be the dictionary for that specific node, but will be tied back to the parent dictionary (because it's a key of the original dictionary).
This will keep building up the nested dictionary, and we'll be able to access the whole thing using the variable tree we define before the function. Think of it like each recursive call building a piece of the tree, which we can access after all the functions are done.
Instructions
Fill in the sections labelled "Insert code here..." in the id3 function.
-
The first section should assign the correct label to the
treedictionary.- This can be done by setting the
labelkey equal to the correct label.
- This can be done by setting the
-
The second section should assign the
columnandmediankeys to thetreedictionary.- The values should be equal to
best_columnandcolumn_median.
- The values should be equal to
Finally, call the id3 function with the right inputs -- id3(data, "high_income", ["age", "marital_status"], tree).
# Create a dictionary to hold the tree. This has to be outside the function so we can access it later.
tree = {}
# This list will let us number the nodes. It has to be a list so we can access it inside the function.
nodes = []
def id3(data, target, columns, tree):
unique_targets = pandas.unique(data[target])
# Assign the number key to the node dictionary.
nodes.append(len(nodes) + 1)
tree["number"] = nodes[-1]
if len(unique_targets) == 1:
# Insert code here to assign the "label" field to the node dictionary.
return
best_column = find_best_column(data, target, columns)
column_median = data[best_column].median()
# Insert code here to assign the "column" and "median" fields to the node dictionary.
left_split = data[data[best_column] <= column_median]
right_split = data[data[best_column] > column_median]
split_dict = [["left", left_split], ["right", right_split]]
for name, split in split_dict:
tree[name] = {}
id3(split, target, columns, tree[name])
# Call the function on our data to set the counters properly.
id3(data, "high_income", ["age", "marital_status"], tree)
tree = {}
nodes = []
def id3(data, target, columns, tree):
unique_targets = pandas.unique(data[target])
nodes.append(len(nodes) + 1)
tree["number"] = nodes[-1]
if len(unique_targets) == 1:
if 0 in unique_targets:
tree["label"] = 0
elif 1 in unique_targets:
tree["label"] = 1
return
best_column = find_best_column(data, target, columns)
column_median = data[best_column].median()
tree["column"] = best_column
tree["median"] = column_median
left_split = data[data[best_column] <= column_median]
right_split = data[data[best_column] > column_median]
split_dict = [["left", left_split], ["right", right_split]]
for name, split in split_dict:
tree[name] = {}
id3(split, target, columns, tree[name])
id3(data, "high_income", ["age", "marital_status"], tree)
7: A Prettier Tree
The tree dictionary shows all the relevant information, but it doesn't look very good. We can fix this by printing out our dictionary in a nicer way.
In order to do this, we'll need to recursively iterate through our tree dictionary. If we find a dictionary with a label key, then we know it's a leaf, so we print out the label of the leaf. Otherwise, we loop through the left and right keys of the tree, and recursively call the same function. We'll also need to keep track of a depth variable so we can indent the nodes properly to indicate which nodes come before others. When we print out anything, we'll take the depth variable into account by adding space beforehand.
Here's pseudocode:
def print_node(tree, depth):
1 Check for the presence of the "label" key in tree
2 If it's found, print the label and return
3 Print out the column and median keys of tree
4 Iterate through the "left" and "right" keys in tree
5 Recursively call print_node(tree[key], depth+1)
Instructions
Fill in the needed code in theprint_node function where it says"Insert code here...".
- Your code should iterate through both branches in order of the
brancheslist, and recursively callprint_node.- Don't forget to increment depth when you call
print_node.
- Don't forget to increment depth when you call
Call print_node and pass in tree anddepth 0.
def print_with_depth(string, depth):
# Add space before a string.
prefix = " " * depth
# Print a string, appropriately indented.
print("{0}{1}".format(prefix, string))
def print_node(tree, depth):
# Check for the presence of label in the tree.
if "label" in tree:
# If there's a label, then this is a leaf, so print it and return.
print_with_depth("Leaf: Label {0}".format(tree["label"]), depth)
# This is critical -- without it, you'll get infinite recursion.
return
# Print information about what the node is splitting on.
print_with_depth("{0} > {1}".format(tree["column"], tree["median"]), depth)
# Create a list of tree branches.
branches = [tree["left"], tree["right"]]
# Insert code here to recursively call print_node on each branch.
# Don't forget to increment depth when you pass it in!
print_node(tree, 0)
def print_node(tree, depth):
if "label" in tree:
print_with_depth("Leaf: Label {0}".format(tree["label"]), depth)
return
print_with_depth("{0} > {1}".format(tree["column"], tree["median"]), depth)
for branch in [tree["left"], tree["right"]]:
print_node(branch, depth+1)
print_node(tree, 0)
8: Predicting With The Printed Tree
Now that we've printed out the tree, we can see what the split points are:
age > 37.5
age > 25.0
age > 22.5
Leaf: Label 0
Leaf: Label 1
Leaf: Label 1
age > 55.0
age > 47.5
Leaf: Label 0
Leaf: Label 1
Leaf: Label 0
The left branch is printed first, then the right branch. Each node prints the criteria that it is split based on. It's easy to tell how to predict a new value by looking at this tree.
Let's say we wanted to predict the following row:
age marital_status
50 1
We'd first split on age > 37.5, and go to the right. Then, we'd split on age > 55.0, and go to the left. Then, we'd split on age > 47.5, and go to the right. We'd end up predicting a 1 for high_income.
It's simple to make predictions with such a small tree, but what if we want to use the whole income dataframe? We wouldn't be able to make predictions by eye, and would want an automated way to do so.
9: Automatic Predictions
Let's work on writing a function to make predictions automatically. All we'll have to do is follow the split points we've already defined with a new row.
Here's pseudocode:
def predict(tree, row):
1 Check for presence of "label" in the tree dictionary
2 If it's found, return tree["label"]
3 Extract tree["column"] and tree["median"]
4 Check to see if row[tree["column"]] is less than or equal to tree["median"]
5 If it's less, than or equal, call predict(tree["left"], row) and return the result
6 If it's greater, call predict(tree["right"], row) and return the result
The major difference here is that we're returning values. Since we're only calling the function recursively once in each iteration (we only go "down" a single branch), we can return a single value up the chain of recursion. This will let us get a value back when we call the function.
Instructions
Fill in the code in the predictfunction where it says "Insert code here...".
- The code should check if
row[column]is less than or equal tomedian, and return the appropriate result for each side of the tree. - Print out the result of predicting the first row of the data --
predict(tree, data.iloc[0]).
def predict(tree, row):
if "label" in tree:
return tree["label"]
column = tree["column"]
median = tree["median"]
# Insert code here to check if row[column] is less than or equal to median
# If it's less than or equal, return the result of predicting on the left branch of the tree
# If it's greater, return the result of predicting on the right branch of the tree
# Remember to use the return statement to return the result!
# Print the prediction for the first row in our data.
print(predict(tree, data.iloc[0]))
def predict(tree, row):
if "label" in tree:
return tree["label"]
column = tree["column"]
median = tree["median"]
if row[column] <= median:
return predict(tree["left"], row)
else:
return predict(tree["right"], row)
print(predict(tree, data.iloc[0]))
10: Making Multiple Predictions
Now that we can make a prediction for a single row, we can write a function to make predictions on multiple rows at once.
We can use the apply method on Pandas dataframes to apply a function across each row. You can read more about it here. You'll need to pass in the axis=1 argument to apply the function to each row. This method will return a dataframe.
You can use the apply method along with lambda functions to apply the predict function to each row of new_data.
Instructions
Create a function calledbatch_predict that takes two parameters, tree, and df.
- It should use the
applymethod to apply the predict function across each row ofdf.- You can use lambda functions to pass
treeandrowintopredict.
- You can use lambda functions to pass
Call batch_predict with new_data as the parameter df and assign the result to predictions.
new_data = pandas.DataFrame([
[40,0],
[20,2],
[80,1],
[15,1],
[27,2],
[38,1]
])
# Assign column names to the data.
new_data.columns = ["age", "marital_status"]
def batch_predict(tree, df):
# Insert your code here.
pass
predictions = batch_predict(tree, new_data)
def batch_predict(tree, df):
return df.apply(lambda x: predict(tree, x), axis=1)
predictions = batch_predict(tree, new_data)
11: Conclusion
In this mission, we learned how to create a full decision tree model, print the results, and make predictions using the tree. We applied a modified version of the ID3 algorithm.
We worked on a small dataset to keep the computation simple and understandable. In future missions, we'll apply decision trees across larger datasets, learn the tradeoffs of the different algorithms, and explore generating more accurate predictions from decision trees.