本文主要是介绍PyQt5_pyqtgraph散点图,希望对大家解决编程问题提供一定的参考价值,需要的开发者们随着小编来一起学习吧!
目录
效果:
代码:
使用:
效果:

代码:
需要的包与字符串横坐标控件
import sys,json
from typing import Dict,Any
from PyQt5 import QtCore,QtGui,QtWidgets
import pyqtgraph as pg
import pyqtgraph.examples
pg.setConfigOption('background','w')
pg.setConfigOption('foreground','k')class RotateAxisItem(pg.AxisItem):def drawPicture(self, p, axisSpec, tickSpecs, textSpecs):p.setRenderHint(p.Antialiasing,False)p.setRenderHint(p.TextAntialiasing,True)## draw long line along axispen,p1,p2 = axisSpecp.setPen(pen)p.drawLine(p1,p2)p.translate(0.5,0)  ## resolves some damn pixel ambiguity## draw ticksfor pen,p1,p2 in tickSpecs:p.setPen(pen)p.drawLine(p1,p2)## draw all text# if self.tickFont is not None:#     p.setFont(self.tickFont)p.setPen(self.pen())for rect,flags,text in textSpecs:# this is the important partp.save()p.translate(rect.x(),rect.y())p.rotate(-30)p.drawText(-rect.width(),rect.height(),rect.width(),rect.height(),flags,text)# restoring the painter is *required*!!!p.restore()
散点图控件
# 散点图
class PyQtGraphScatterWidget(QtWidgets.QWidget):def __init__(self):super().__init__()self.temp_mark = 0self.init_data()self.init_ui()def init_data(self):# https://www.sioe.cn/yingyong/yanse-rgb-16/self.current_point_color = (220,20,60) # 猩红self.point_color = (0,0,255) # 纯蓝passdef init_ui(self):self.title_label = QtWidgets.QLabel('散点图')self.title_label.setAlignment(QtCore.Qt.AlignCenter)xax = RotateAxisItem(orientation='bottom')xax.setHeight(h=50)self.pw = pg.PlotWidget(axisItems={'bottom': xax})self.pw.setMouseEnabled(x=True, y=False)self.pw.setAutoVisible(x=False, y=True)layout = QtWidgets.QVBoxLayout()layout.addWidget(self.title_label)layout.addWidget(self.pw)self.setLayout(layout)passdef set_data(self,data:Dict[str,Any]):scatters = pg.ScatterPlotItem(hoverable=True,hoverPen=pg.mkPen('g'),tip=None)spots3 = []# temp startself.x_ticks = [(0, 'aaa'), (1, 'bbb'), (2, 'ccc'), (3, 'ddd'), (4, 'eee'), (5, 'fff'), (6, 'ggg'), (7, 'hhh'),(8, 'iii'), (9, 'jjj')]xax = self.pw.getAxis('bottom')xax.setTicks([self.x_ticks])x = [0, 1, 2, 3, 4, 5, 6, 7, 8, 9]self.y = [43.5, 78.9, 23.1, 20.9, 9.6, 33.5, 88.9, 13.1, 10.9, 19.6]for x0,y0 in zip(x,self.y):if x0==5:spots3.append({'pos': (x0, y0),'size': 10,'pen': {'color': self.current_point_color, 'width': 2},'brush': pg.mkBrush(color=self.current_point_color),'symbol':'star'})else:spots3.append({'pos':(x0,y0),'size':5,'pen':{'color':self.point_color,'width':2},'brush':pg.mkBrush(color=self.point_color)})pass# temp endscatters.addPoints(spots3)self.pw.addItem(scatters)self.label = pg.TextItem()self.pw.addItem(self.label)scatters.sigClicked.connect(self.scatter_clicked)scatters.sigHovered.connect(self.scatter_hovered)passdef scatter_clicked(self,plot,points):index_val = points[0].index()print(index_val)passdef scatter_hovered(self,plot,points):if len(points)<=0:returncur_x = points[0].pos()[0]cur_y = points[0].pos()[1]index_val = points[0].index()x_str = self.x_ticks[index_val][1]y_val = self.y[index_val]html_str = '<p style="color:black;font-size:12px;">'+x_str+' '+str(y_val)+'</p>'self.label.setHtml(html_str)self.label.setPos(cur_x,cur_y)print('hovered::',points[0].index(),points[0].pos())
使用:
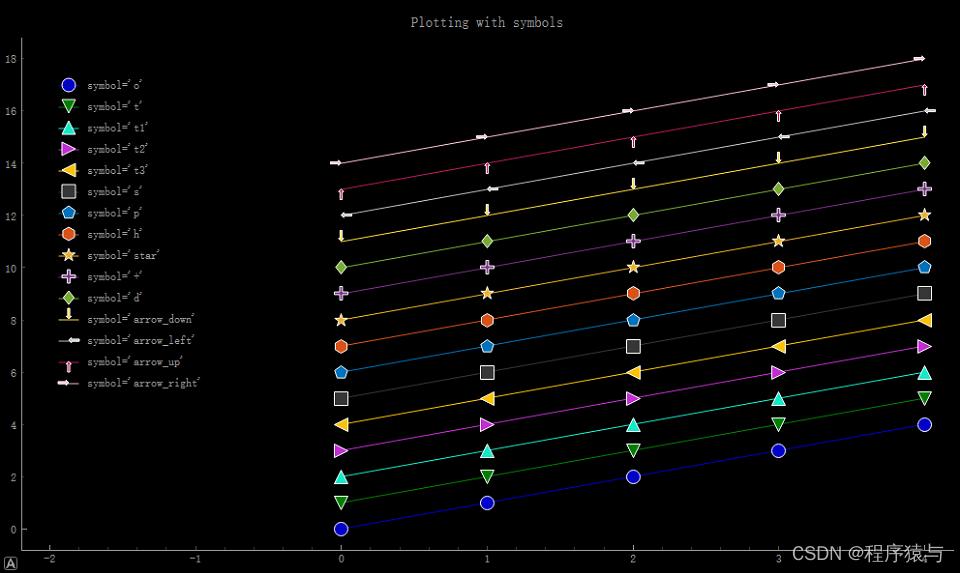
if __name__ == '__main__':app = QtWidgets.QApplication(sys.argv)t_win = PyQtGraphScatterWidget()t_win.show()t_win.set_data(None)sys.exit(app.exec_())pass点symbol的样式备忘
这篇关于PyQt5_pyqtgraph散点图的文章就介绍到这儿,希望我们推荐的文章对编程师们有所帮助!


