本文主要是介绍java中使用JFreeChart生成饼图和曲线图(横坐标字符串),希望对大家解决编程问题提供一定的参考价值,需要的开发者们随着小编来一起学习吧!
最近项目中有个需求要根据不同的数据,生成一个饼图,用来表示各部分的占比情况,测试了很多,最后发现JFreeChart最简便实用,下面是具体实现过程
1,pom文件中添加jar包的引用
org.jfree jfreechart 1.0.19 2,创建生成图片的方法public class JFreeChartUtil {
public static void main(String[] args) {
DefaultPieDataset pds = new DefaultPieDataset();
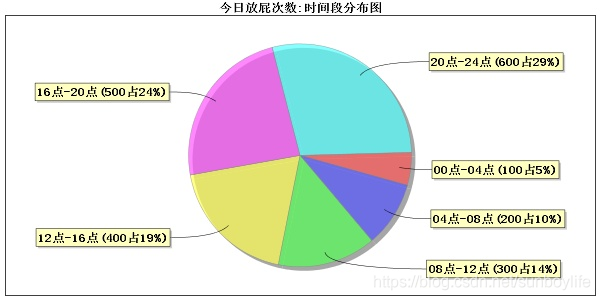
pds.setValue(“00点-04点”, 100);
pds.setValue(“04点-08点”, 200);
pds.setValue(“08点-12点”, 300);
pds.setValue(“12点-16点”, 400);
pds.setValue(“16点-20点”, 500);
pds.setValue(“20点-24点”, 600);
String filePath = “d:/pie.jpg”;
createPieChart(pds,filePath);
}
public static void createPieChart(DefaultPieDataset pds, String filePath) {try {// 分别是:显示图表的标题、需要提供对应图表的DateSet对象、是否显示图例、是否生成贴士以及是否生成URL链接JFreeChart chart = ChartFactory.createPieChart("今日放屁次数:时间段分布图", pds, false, false, true);// 如果不使用Font,中文将显示不出来Font font = new Font("宋体", Font.BOLD, 12);// 设置图片标题的字体chart.getTitle().setFont(font);// 得到图块,准备设置标签的字体PiePlot plot = (PiePlot) chart.getPlot();// 设置标签字体plot.setLabelFont(font);plot.setStartAngle(new Float(3.14f / 2f));// 设置plot的前景色透明度plot.setForegroundAlpha(0.7f);// 设置plot的背景色透明度plot.setBackgroundAlpha(0.0f);// 设置标签生成器(默认{0})// {0}:key {1}:value {2}:百分比 {3}:sumplot.setLabelGenerator(new StandardPieSectionLabelGenerator("{0}({1}占{2})"));// 将内存中的图片写到本地硬盘ChartUtilities.saveChartAsJPEG(new File(filePath), chart, 600, 300);} catch (Exception e) {e.printStackTrace();}
}
}
3,生成的效果图如下:

4,生成折线图的代码
public class JFreeChartUtil {
public static void main(String[] args) {
DefaultCategoryDataset ds = new DefaultCategoryDataset();
ds.setValue(10, “ibm”, “2018-05-21”);
ds.setValue(20, “ibm”, “2018-05-22”);
ds.setValue(32, “ibm”, “2018-05-23”);
ds.setValue(25, “ibm”, “2018-05-24”);
ds.setValue(0, “ibm”, “2018-05-25”);
ds.setValue(4, “ibm”, “2018-05-26”);
ds.setValue(32, “ibm”, “2018-05-27”);
ds.setValue(0, “ibm”, “2018-05-28”);
ds.setValue(358, “ibm”, “2018-05-29”);
ds.setValue(4, “ibm”, “2018-05-30”);
String filePath = “d:/lgg.jpg”;
createPieChart(pds,filePath);
}
public static void createLineChart(DefaultCategoryDataset ds, String filePath) {
try {
// 创建柱状图.标题,X坐标,Y坐标,数据集合,orientation,是否显示legend,是否显示tooltip,是否使用url链接
JFreeChart chart = ChartFactory.createLineChart(“近30天每日放屁次数趋势图”, “”, “次数”, ds, PlotOrientation.VERTICAL,false, true, true);
chart.setBackgroundPaint(Color.WHITE);
Font font = new Font(“宋体”, Font.BOLD, 12);
chart.getTitle().setFont(font);
chart.setBackgroundPaint(Color.WHITE);
// 配置字体(解决中文乱码的通用方法)
Font xfont = new Font(“仿宋”, Font.BOLD, 12); // X轴
Font yfont = new Font(“宋体”, Font.BOLD, 12); // Y轴
Font titleFont = new Font(“宋体”, Font.BOLD, 12); // 图片标题
CategoryPlot categoryPlot = chart.getCategoryPlot();
categoryPlot.getDomainAxis().setLabelFont(xfont);
categoryPlot.getDomainAxis().setLabelFont(xfont);
categoryPlot.getRangeAxis().setLabelFont(yfont);
chart.getTitle().setFont(titleFont);
categoryPlot.setBackgroundPaint(Color.WHITE);
// x轴 // 分类轴网格是否可见
categoryPlot.setDomainGridlinesVisible(true);
// y轴 //数据轴网格是否可见
categoryPlot.setRangeGridlinesVisible(true);
// 设置网格竖线颜色
categoryPlot.setDomainGridlinePaint(Color.LIGHT_GRAY);
// 设置网格横线颜色
categoryPlot.setRangeGridlinePaint(Color.LIGHT_GRAY);
// 没有数据时显示的文字说明
categoryPlot.setNoDataMessage(“没有数据显示”);
// 设置曲线图与xy轴的距离
categoryPlot.setAxisOffset(new RectangleInsets(0d, 0d, 0d, 0d));
// 设置面板字体
Font labelFont = new Font(“SansSerif”, Font.TRUETYPE_FONT, 12);
// 取得Y轴
NumberAxis rangeAxis = (NumberAxis) categoryPlot.getRangeAxis();
rangeAxis.setStandardTickUnits(NumberAxis.createIntegerTickUnits());
rangeAxis.setAutoRangeIncludesZero(true);
rangeAxis.setUpperMargin(0.20);
rangeAxis.setLabelAngle(Math.PI / 2.0);
// 取得X轴
CategoryAxis categoryAxis = (CategoryAxis) categoryPlot.getDomainAxis();
// 设置X轴坐标上的文字
categoryAxis.setTickLabelFont(labelFont);
// 设置X轴的标题文字
categoryAxis.setLabelFont(labelFont);
// 横轴上的 Lable 45度倾斜
categoryAxis.setCategoryLabelPositions(CategoryLabelPositions.UP_45);
// 设置距离图片左端距离
categoryAxis.setLowerMargin(0.0);
// 设置距离图片右端距离
categoryAxis.setUpperMargin(0.0);
// 获得renderer 注意这里是下嗍造型到lineandshaperenderer!!
LineAndShapeRenderer lineandshaperenderer = (LineAndShapeRenderer) categoryPlot.getRenderer();
// 是否显示折点
lineandshaperenderer.setBaseShapesVisible(true);
// 是否显示折线
lineandshaperenderer.setBaseLinesVisible(true);
// series 点(即数据点)间有连线可见 显示折点数据
lineandshaperenderer.setBaseItemLabelGenerator(new StandardCategoryItemLabelGenerator());
lineandshaperenderer.setBaseItemLabelsVisible(true);
ChartUtilities.saveChartAsJPEG(new File(filePath), chart, 1207, 500);
} catch (Exception e) {
e.printStackTrace();
}
}
}
5,效果图如下:

————————————————
版权声明:本文为CSDN博主「编码小王子」的原创文章,遵循 CC 4.0 BY-SA 版权协议,转载请附上原文出处链接及本声明。
原文链接:https://blog.csdn.net/u011900448/article/details/80541504
这篇关于java中使用JFreeChart生成饼图和曲线图(横坐标字符串)的文章就介绍到这儿,希望我们推荐的文章对编程师们有所帮助!


