本文主要是介绍链路追踪jaeger多环境部署,希望对大家解决编程问题提供一定的参考价值,需要的开发者们随着小编来一起学习吧!
链路追踪
说明:一个es,三个收集器和三个ui,以索引前缀进行区分环境
jaegerUI工具
docker run -itd --name jaeger.ui.dev -p16686:16686 \-e STORAGE=elasticsearch -e ES_SERVER_URLS=http://172.16.64.12:6123 -e SPAN_STORAGE_TYPE=elasticsearch -e ES_TAGS_AS_FIELDS=true \jaegertracing/all-in-one:1.24 --es.index-prefix=devdocker run -itd --name jaeger.ui.check -p16696:16686 \-e STORAGE=elasticsearch -e ES_SERVER_URLS=http://172.16.64.12:6123 -e SPAN_STORAGE_TYPE=elasticsearch -e ES_TAGS_AS_FIELDS=true \jaegertracing/all-in-one:1.24 --es.index-prefix=checkdocker run -itd --name jaeger.ui.prod -p16706:16686 \-e STORAGE=elasticsearch -e ES_SERVER_URLS=http://172.16.64.12:6123 -e SPAN_STORAGE_TYPE=elasticsearch -e ES_TAGS_AS_FIELDS=true \jaegertracing/all-in-one:1.24 --es.index-prefix=prod
jaeger收集器
docker run -itd --name jaeger.control.dev \-e SPAN_STORAGE_TYPE=elasticsearch -e ES_SERVER_URLS=http://172.16.64.12:6123 -e LOG_LEVEL=debug \-p 14250:14250 -p 14269:14269 -p 14268:14268 \jaegertracing/jaeger-collector:1.24 --es.index-prefix=devdocker run -itd --name jaeger.control.check \-e SPAN_STORAGE_TYPE=elasticsearch -e ES_SERVER_URLS=http://172.16.64.12:6123 -e LOG_LEVEL=debug \-p 14260:14250 -p 14279:14269 -p 14278:14268 \jaegertracing/jaeger-collector:1.24 --es.index-prefix=checkdocker run -itd --name jaeger.control.prod \-e SPAN_STORAGE_TYPE=elasticsearch -e ES_SERVER_URLS=http://172.16.64.12:6123 -e LOG_LEVEL=debug \-p 14270:14250 -p 14289:14269 -p 14288:14268 \jaegertracing/jaeger-collector:1.24 --es.index-prefix=prod
端口说明 14269.信息查询端口、14250.grpc服务端口、 14268.http服务端口
elasticsearch
docker run -p 6123:9200 -p 9300:9300 -itd -e "discovery.type=single-node" --name elastic \-v /data/elastic/:/usr/share/elasticsearch/data \docker.elastic.co/elasticsearch/elasticsearch:7.9.2
另外jaeger.ui 的界面是可以自定义的,类似如下图
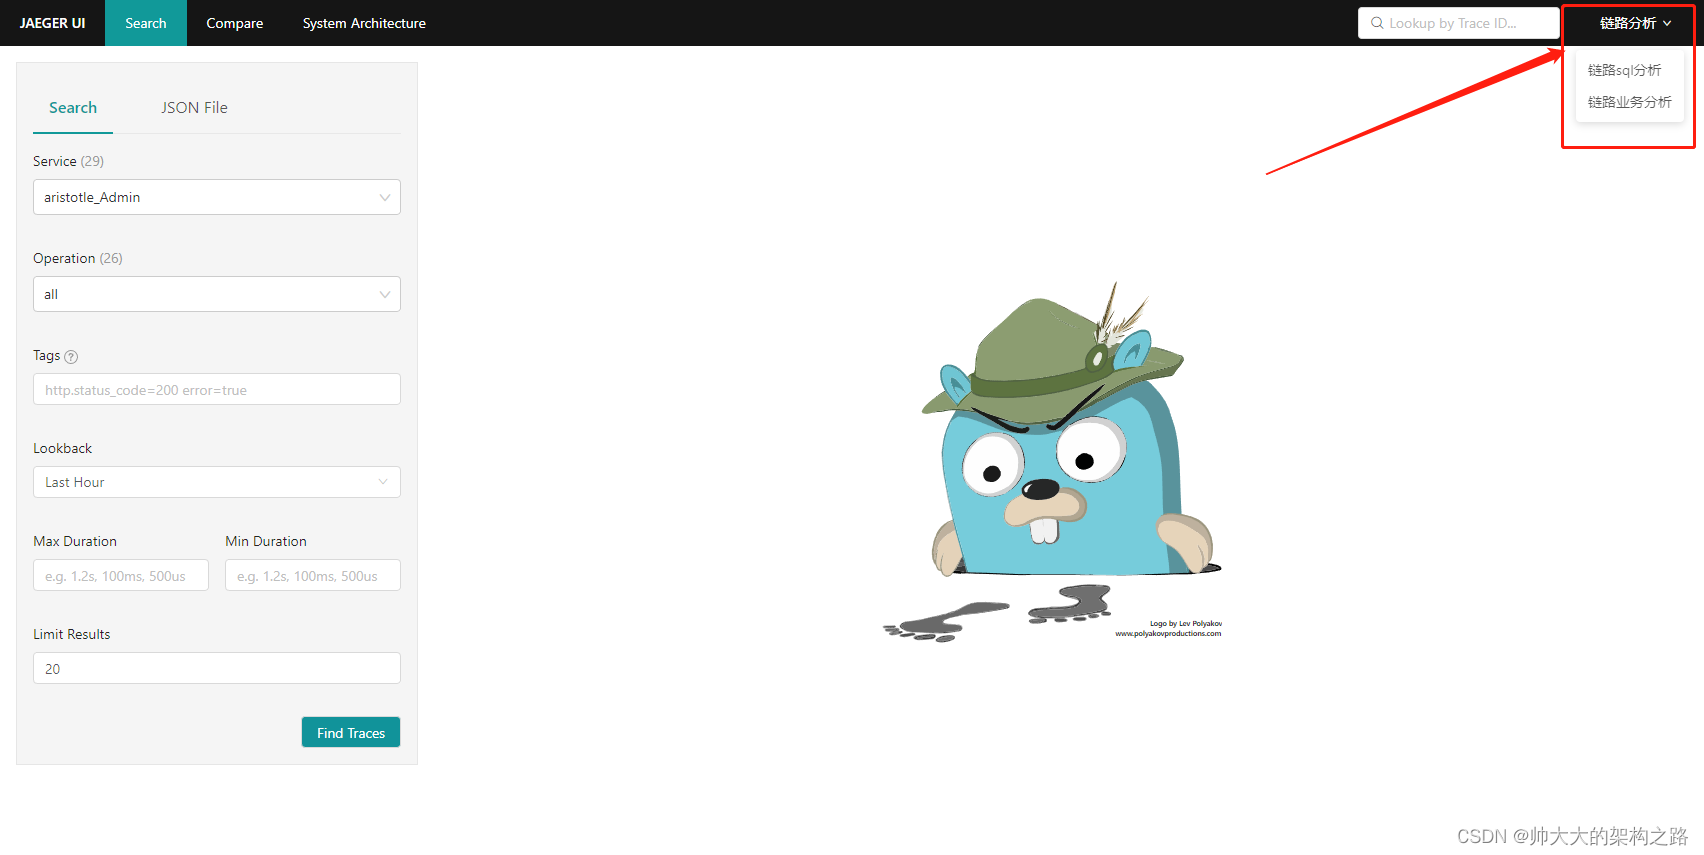
这种配置只需要在最初创建容器的时候指定一个配置
docker run -itd --name jaeger.ui.prod2 -p 16706:16686 -e STORAGE=elasticsearch -e ES_SERVER_URLS=http://172.16.64.12:6123 -e SPAN_STORAGE_TYPE=elasticsearch -e ES_TAGS_AS_FIELDS=true -v /etc/jaeger:/etc/conf.d jaegertracing/all-in-one:1.24 --es.index-prefix=prod --query.ui-config=etc/conf.d/prod.jaeger-ui.conf.json
prod.jaeger-ui.conf.json内容
{"dependencies": {"dagMaxNumServices": 200,"menuEnabled": true},"monitor": {"menuEnabled": true},"archiveEnabled": true,"tracking": {"gaID": "UA-000000-3","trackErrors": true},"menu": [{"label": "链路分析","items": [{"label": "链路sql分析","url": "http://172.16.64.12:9002/trace/analyse/high_time_sql/view"},{"label":"链路业务分析","url":"http://172.16.64.12:9002/trace/analyse/high_time_trace/view"}]}],"search": {"maxLookback": {"label": "5 Days","value": "5d"},"maxLimit": 1500},"linkPatterns": [{"type": "process","key": "jaeger.version","url": "https://github.com/jaegertracing/jaeger-client-java/releases/tag/#{jaeger.version}","text": "Information about Jaeger release #{jaeger.version}"}]
}
然后通过点击上图中对应的链接,就会跳转到对应的页面
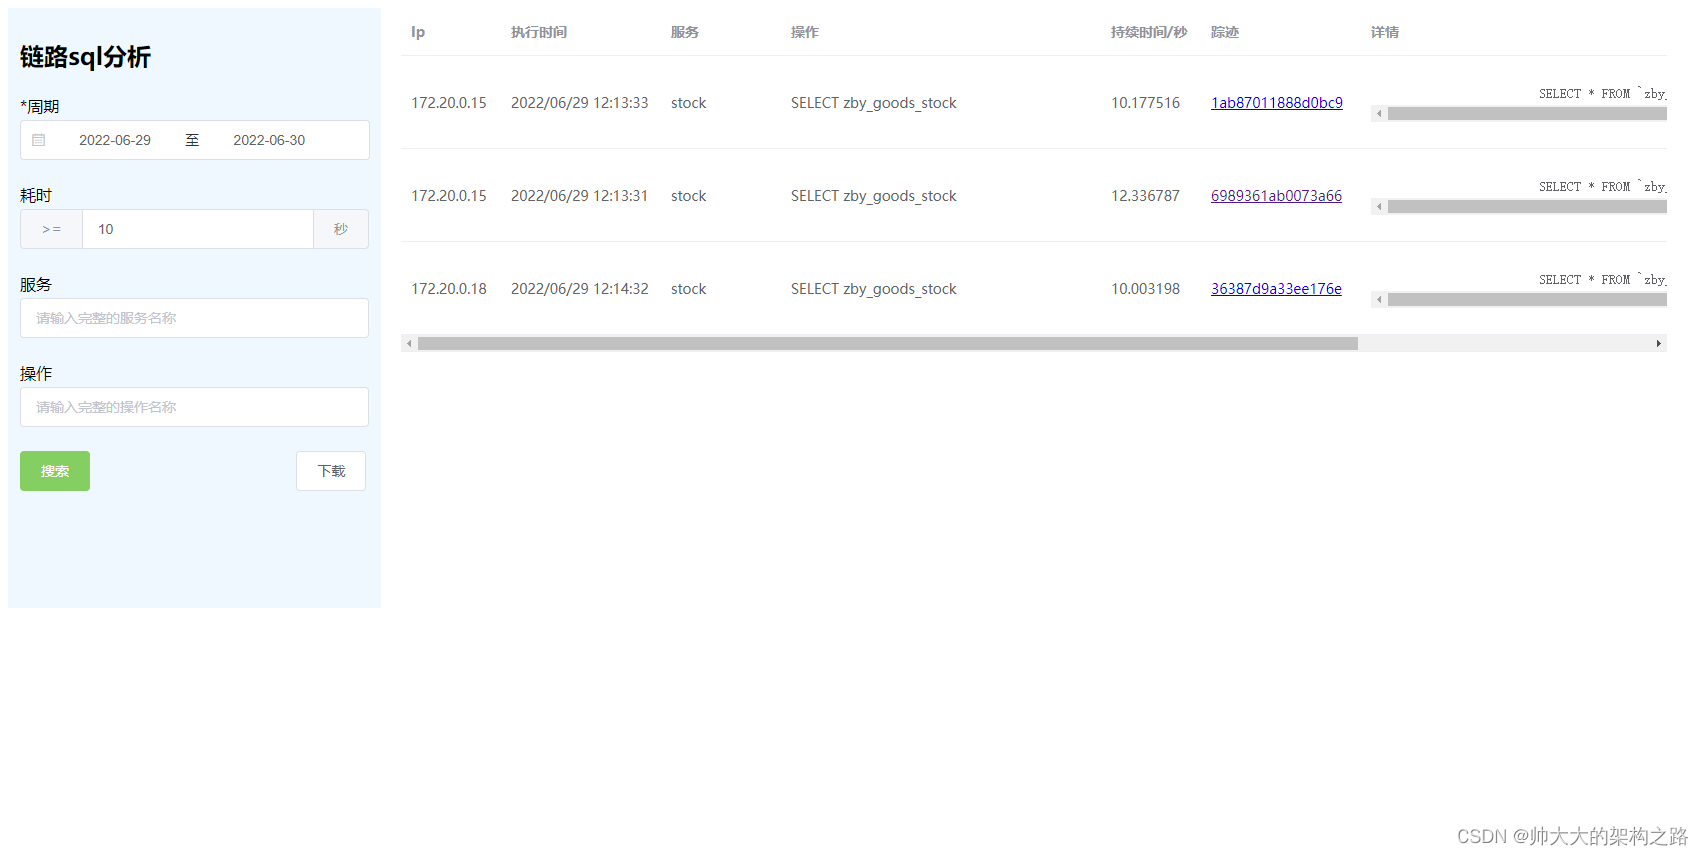
这个页面前端是用vue写的,后端用golang
将es换成clickhouse,节约磁盘
前言:
clickhouse 为列式存储引擎,
与es比有数据高压缩率优势。
clickhouse安装
端口 8123.http访问端口、9000.客户端访问端口、9363.prometheus监控端口
config.xml(配置文件比较大,可以建一个新容器然后从里面拷贝出来)
# 只修改这个地方,把注释打开<prometheus><endpoint>/metrics</endpoint><port>9363</port><metrics>true</metrics><events>true</events><asynchronous_metrics>true</asynchronous_metrics></prometheus>docker run -itd --name clickhouse --ulimit nofile=262144:262144 \-p 18123:8123 -p 19000:9000 -p 19363:9363 \-v /soft/src/clickhouse/data:/var/lib/clickhouse \-v /soft/src/clickhouse/config.xml:/etc/clickhouse-server/config.xml \-v /soft/src/clickhouse/logs:/var/log/clickhouse-server clickhouse/clickhouse-server
桌面客户端
下载地址 https://dbeaver.io/download/
使用方式与navicat 一致,就不详细讲解了。
jaeger工具链接clickhouse
插件附件(config.yaml jaeger-clickhouse)
config.yaml
# clickhouse 存储引擎访问地址
address: 172.16.64.12:19000
# Directory with .sql files to run at plugin startup, mainly for integration tests.
# Depending on the value of "init_tables", this can be run as a
# replacement or supplement to creating default tables for span storage.
# If init_tables is also enabled, the scripts in this directory will be run first.
init_sql_scripts_dir:
# Whether to automatically attempt to create tables in ClickHouse.
# By default, this is enabled if init_sql_scripts_dir is empty,
# or disabled if init_sql_scripts_dir is provided.
init_tables:
# Maximal amount of spans that can be pending writes at a time.
# New spans exceeding this limit will be discarded,
# keeping memory in check if there are issues writing to ClickHouse.
# Check the "jaeger_clickhouse_discarded_spans" metric to keep track of discards.
# If 0, no limit is set. Default 10_000_000.
max_span_count:
# Batch write size. Default 10_000.
batch_write_size:
# Batch flush interval. Default 5s.
batch_flush_interval:
# Encoding of stored data. Either json or protobuf. Default json.
encoding:
# Path to CA TLS certificate.
ca_file:
# Username for connection to ClickHouse. Default is "default".
username:
# Password for connection to ClickHouse.
password:
# ClickHouse database name. The database must be created manually before Jaeger starts. Default is "default".
database: dev
# If non-empty, enables a tenant column in tables, and uses the provided tenant name for this instance.
# Default is empty. See guide-multitenancy.md for more information.
tenant:
# 用于服务prometheus指标的端点。默认localhost: 9090。 必填(不开放时建议填一个无用端口)
metrics_endpoint: localhost:9091
# Whether to use sql scripts supporting replication and sharding.
# Replication can be used only on database with Atomic engine.
# Default false.
replication:
# Table with spans. Default "jaeger_spans_local" or "jaeger_spans" when replication is enabled.
# 前缀,可自己指定
spans_table: otel_traces
# Span index table. Default "jaeger_index_local" or "jaeger_index" when replication is enabled.
# 前缀,可自己指定
spans_index_table: otel_traces_trace_id_ts
# Operations table. Default "jaeger_operations_local" or "jaeger_operations" when replication is enabled.
operations_table:
# TTL for data in tables in days. If 0, no TTL is set. Default 0.
ttl:
# The maximum number of spans to fetch per trace. If 0, no limit is set. Default 0.
max_num_spans:
如果三个环境用同一个clickhouse,需要指定(database: dev)库,通过不同的库区分,避免索引冲突,当然库需要提前创建
jaeger-clickhouse见附件(详情见官网:https://www.jaegertracing.io/docs/1.52/deployment/#remote-storage-component)
SPAN_STORAGE_TYPE=grpc-plugin 存储类型改为插件
–grpc-storage-plugin.binary 配置插件路径(容器内路径)
–grpc-storage-plugin.configuration-file 配置插件配置文件路径(容器内路径)
jaeger collector 收集器
jaeger.conrol 组件删除原有的重启新的,数据的存储地址调整为clickhouse
docker run -itd --name jaeger.control-dev \-e SPAN_STORAGE_TYPE=grpc-plugin \-v /soft/src/clickhouse-dev/jaeger-clickhouse:/home/jaeger-clickhouse \-v /soft/src/clickhouse-dev/config.yaml:/home/config.yaml \-p 14250:14250 -p 14269:14269 -p 14268:14268 \jaegertracing/jaeger-collector:1.52 --grpc-storage-plugin.binary=/home/jaeger-clickhouse --grpc-storage-plugin.configuration-file=/home/config.yaml
jaeger query 查询ui
jaeger·ui 组件删除原有容器重启新的容器,数据读取来源调整为clickhouse
docker run -itd --name jaeger.ui-dev \-e SPAN_STORAGE_TYPE=grpc-plugin \-p 18686:16686 \-p 18687:16687 \-p 18685:16685 \-v /soft/src/clickhouse-dev/jaeger-clickhouse:/home/jaeger-clickhouse \-v /soft/src/clickhouse-dev/config.yaml:/home/config.yaml \jaegertracing/jaeger-query:1.52 --grpc-storage-plugin.binary=/home/jaeger-clickhouse --grpc-storage-plugin.configuration-file=/home/config.yaml
这篇关于链路追踪jaeger多环境部署的文章就介绍到这儿,希望我们推荐的文章对编程师们有所帮助!


