本文主要是介绍柏林噪声C++,希望对大家解决编程问题提供一定的参考价值,需要的开发者们随着小编来一起学习吧!
柏林噪声
随机噪声

如上图所示随机噪声没有任何规律可言,我们希望生成有一些意义的局部连续的随机图案
一维柏林噪声

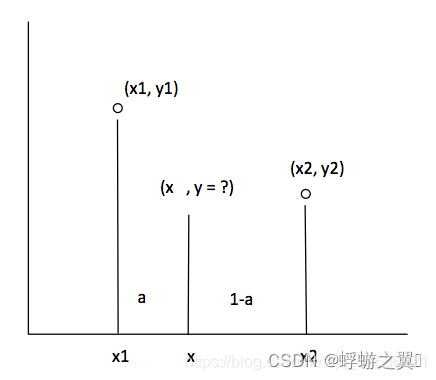
假设希望生成一段局部连续的随机曲线,可以采用插值的方式:在固定点随机分配y值(一般是整数点),其他的点使用插值算法
方法一:线性插值的方式
公式如下:

【数字图像处理】二维(2D)线性插值的应用
y = a*y1 + (1-a)*y2
我们画图看看:

import math
import numpy as np
import matplotlib.pyplot as pltperm = [151,160,137,91,90,15,131,13,201,95,96,53,194,233,7,225,140,36,103,30,69,142,8,99,37,240,21,10,23,190, 6,148,247,120,234,75,0,26,197,62,94,252,219,203,117,35,11,32,57,177,33,88,237,149,56,87,174,20,125,136,171,168, 68,175,74,165,71,134,139,48,27,166,77,146,158,231,83,111,229,122,60,211,133,230,220,105,92,41,55,46,245,40,244,102,143,54, 65,25,63,161, 1,216,80,73,209,76,132,187,208, 89,18,169,200,196,135,130,116,188,159,86,164,100,109,198,173,186, 3,64,52,217,226,250,124,123,5,202,38,147,118,126,255,82,85,212,207,206,59,227,47,16,58,17,182,189,28,42,223,183,170,213,119,248,152, 2,44,154,163, 70,221,153,101,155,167, 43,172,9,129,22,39,253, 19,98,108,110,79,113,224,232,178,185, 112,104,218,246,97,228,251,34,242,193,238,210,144,12,191,179,162,241, 81,51,145,235,249,14,239,107,49,192,214, 31,181,199,106,157,184, 84,204,176,115,121,50,45,127, 4,150,254,138,236,205,93,222,114,67,29,24,72,243,141,128,195,78,66,215,61,156,180]def perlin1D(x):# 整数x1和x2的坐标x1 = math.floor(x)x2 = x1 + 1# x1和x2的梯度值grad1 = perm[x1 % 255] * 2.0 - 255.0grad2 = perm[x2 % 255] * 2.0 - 255.0#x1和x2指向x的方向向量vec1 = x - x1vec2 = x - x2# x到x1的距离即vec1,利用公式3计算平滑参数t = 3 * pow(vec1, 2) - 2 * pow(vec1, 3)#梯度值与方向向量的乘积product1 = grad1 * vec1product2 = grad2 * vec2return product1 + t * (product2 - product1)def linear1D(x):# 整数x1和x2的坐标x1 = math.floor(x)x2 = x1 + 1# y值 随机数grad1 = perm[x1 % 255] * 2.0 - 255.0grad2 = perm[x2 % 255] * 2.0 - 255.0t=x - x1return grad1 + t * (grad2 - grad1)def linear1D_plus(x):# 整数x1和x2的坐标x1 = math.floor(x)x2 = x1 + 1# x1和x2的梯度值grad1 = perm[x1 % 255] * 2.0 - 255.0grad2 = perm[x2 % 255] * 2.0 - 255.0#x1和x2指向x的方向向量vec1 = x - x1vec2 = x - x2t=x - x1#梯度值与方向向量的乘积product1 = grad1 * vec1product2 = grad2 * vec2return product1 + t * (product2 - product1)def draw1D():# 绘制散点图x0=[]y0=[]for i in range(11):x0.append(i)y0.append( perm[i] * 2.0 - 255.0)plt.scatter(x0, y0,color='red')# 绘制1D的图像x = np.linspace(0, 10, 100)y = np.zeros(100)y1 = np.zeros(100)y2 = np.zeros(100)for i in range(100):y[i] = perlin1D(x[i])y1[i] = linear1D(x[i])y2[i] =linear1D_plus(x[i])# 绘制图像plt.plot(x, y,color='deepskyblue')plt.plot(x, y1,color='green')plt.plot(x, y2,color='orange')plt.show()draw1D()
线性插值
x取[0,10]这个区间,y在整数点随机取值,非整数点使用线性插值
ps 随机值使用伪随机数perm,柏林噪声在图像领域使用,颜色的取值范围是[0,255],所以perm的值也是[0,255]
上图红色的点是:整数点随机取值的结果,绿色的线是线性插值。
y = t ∗ y 2 + ( 1 − t ) ∗ y 1 = y 1 + t ( y 2 − y 1 ) y = t*y2+ (1-t)*y1 = y1 + t(y2- y1 ) y=t∗y2+(1−t)∗y1=y1+t(y2−y1)
t = x − x 1 t=x-x1 t=x−x1
线性插值plus
我们希望它更平滑一点,如果插值点x的值y与附近点x1,x2的位置相关
所以改进上述算法:
y = t ∗ y 2 ∗ w 2 + ( 1 − t ) ∗ y 1 ∗ w 1 = y 1 ∗ w 1 + t ( y 2 ∗ w 2 − y 1 ∗ w 1 ) y = t*y2*w2 + (1-t)*y1*w1 = y1*w1 + t(y2*w2 - y1*w1 ) y=t∗y2∗w2+(1−t)∗y1∗w1=y1∗w1+t(y2∗w2−y1∗w1)
w是权重系数,也是柏林算法中的方向向量vec1 = x - x1
如图中黄色的线
柏林噪声
柏林噪声在此基础上再加强一步:
t = 3 t 2 − 2 t 3 t=3t^2 -2t^3 t=3t2−2t3
算法步骤:
input: x
- 计算周围的点:x1 , x2
- 计算x1 , x2 梯度 : grad1, grad2 随机取[0,255]
- 方向向量: (vec1 =x-x1 ;vec2 = x-x2)
- 梯度值与方向向量的乘积 product=grad*vec
- 计算系数 t=3t^2 -2t^3
- 插值:y = product1 + t * (product2 - product1)
output :y
根据上述原理 可以画一个不规则的圆形
def drawCircle():#画圆形# 创建一个坐标系fig, ax = plt.subplots()# 定义圆心和半径center = (0, 0)radius = 10# 生成圆的数据theta = np.linspace(0, 2*np.pi, 100)x = radius * np.cos(theta) + center[0]y = radius * np.sin(theta) + center[1]y1 = np.zeros(100)for i in range(100):y1[i] = y[i]+ perlin1D(theta[i]*5)/255*2# 画出圆形ax.plot(x, y,color='orange')ax.plot(x, y1,color='deepskyblue')# 设置坐标轴范围ax.set_xlim([-15, 15])ax.set_ylim([-15, 15])# 显示图像plt.show()

参考文献
Using Perlin Noise to Generate 2D Terrain and Water
FastNoiseSIMD github
libnoise
柏林噪声
一篇文章搞懂柏林噪声算法,附代码讲解
游戏开发技术杂谈2:理解插值函数lerp
[Nature of Code] 柏林噪声
https://adrianb.io/2014/08/09/perlinnoise.html
这篇关于柏林噪声C++的文章就介绍到这儿,希望我们推荐的文章对编程师们有所帮助!


