本文主要是介绍Vue+ ArcGIS JavaScript APi 4.22,希望对大家解决编程问题提供一定的参考价值,需要的开发者们随着小编来一起学习吧!
使用@arcgis/core方式
版本
Vue 2
ArcGIS JavaScript 4.22
注意 ArcGIS JavaScript3.x 和ArcGIS JavaScript 4.x框架差异较大
环境搭建
新建vue
可以使用vue ui创建项目
增加ArcGIS JavaScript 包引用
package.json
"dependencies": {"core-js": "^3.8.3","vue": "^2.6.14", "@arcgis/core":"4.22.2","ncp":"^2.0.0"},"devDependencies": {"@babel/core": "^7.12.16","@babel/eslint-parser": "^7.12.16","@vue/cli-plugin-babel": "~5.0.0","@vue/cli-plugin-eslint": "~5.0.0","@vue/cli-service": "~5.0.0","eslint": "^6.8.0","eslint-plugin-vue": "^5.2.3", "vue-template-compiler": "^2.6.14" },
ncp: 主要用于拷贝资源信息
@arcgis/core 是arcgis_js仓库
拷贝资源信息
package.json中配置copy命令
"scripts": {"serve": "vue-cli-service serve","build": "vue-cli-service build","lint": "vue-cli-service lint","copy": "ncp ./node_modules/@arcgis/core/assets ./public/assets"},
安装完依赖后运行 copy命令
yarn
yarn copy
yarn serve
-------------------
npm i
npm run copy
npm run serve
运行完copy命令后,会将arcgis相关资源拷贝到public/assets目录下
全局引入
main.js
import '@arcgis/core/assets/esri/themes/light/main.css'
import esriConfig from '@arcgis/core/config.js'
esriConfig.assetsPath = './assets'
注意踩坑
记于2023年2月3日坑里
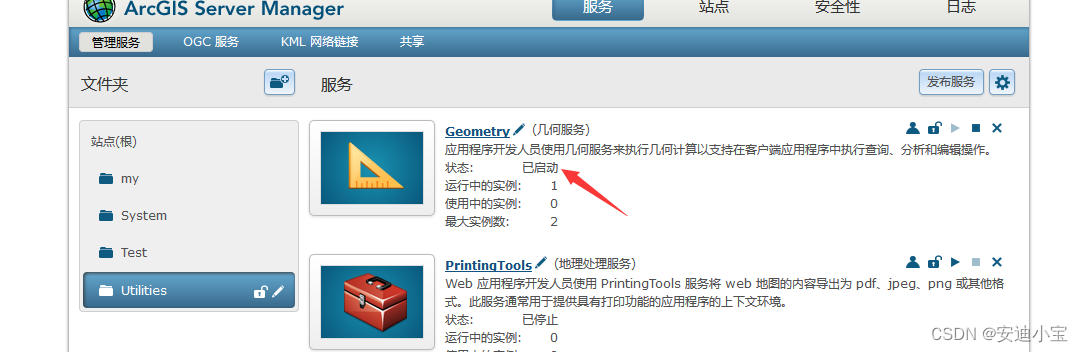
因为部署环境是内网,部署上线后用到的MapView.toScreen方法,在调试的时候有时候方法转换结果为null,地图有时候得到的事一张透明的png。后来发现底图服务并不是3857,是自定义的坐标系。加载mapView时进行了设置mapView的坐标系为3857,两坐标系不一致,需要动态转换过去,需要调用ArcGIS Server的Project,同时toScreen转换结果为null也相应调用了GIS服务的其他空间转换方法。这些方法需要调用GeometryServer服务。ArcGIS Server默认提供了这个服务(在ArcGIS Server 上可以去看看Utilities里面自带的借出去工具)API 源码中配置的esriConfig
import "./core/has.js";
import { deepMerge as e } from "./core/object.js";
var r; const s = {apiKey: void 0,applicationUrl: null == (r = globalThis.location) ? void 0 : r.href,assetsPath: "",fontsUrl: "https://static.arcgis.com/fonts",geometryServiceUrl: "https://utility.arcgisonline.com/arcgis/rest/services/Geometry/GeometryServer",geoRSSServiceUrl: "https://utility.arcgis.com/sharing/rss",kmlServiceUrl: "https://utility.arcgis.com/sharing/kml",portalUrl: "https://www.arcgis.com",routeServiceUrl: "https://route-api.arcgis.com/arcgis/rest/services/World/Route/NAServer/Route_World",workers: { loaderConfig: { has: {}, paths: {}, map: {}, packages: [] } }, request: { httpsDomains: ["arcgis.com", "arcgisonline.com", "esrikr.com", "premiumservices.blackbridge.com", "esripremium.accuweather.com", "gbm.digitalglobe.com", "firstlook.digitalglobe.com", "msi.digitalglobe.com"], interceptors: [], maxUrlLength: 2e3, proxyRules: [], proxyUrl: null, timeout: 6e4, trustedServers: [], useIdentity: !0 }, log: { interceptors: [], level: null }
};
可以看到此处geometryServiceUrl的值 是"https://utility.arcgisonline.com/arcgis/rest/services/Geometry/GeometryServer",在内网环境中访问这不是就翘辫子的事吗,果段进行设置成内网服务中需要的地址。
在main.js中增加
esriConfig.geometryServiceUrl ='http://192.168.3.156:6080//arcgis/rest/services/Utilities/Geometry/GeometryServer'
同样的字体表达,特别是在地图上进行交互,绘制textSymbol时需要的字体,而字体在https://static.arcgis.com/fonts
线上信息里,本地部署不外呼使用本地字体family设置,另外就是把线上字体下载下来。我使用后者吧线上字体下载下来,并拷贝的public/assets/里面
可以参考本人另一篇博客地址
http://t.csdn.cn/ktU5n
完整的main.js如下
import '@arcgis/core/assets/esri/themes/light/main.css'
import esriConfig from '@arcgis/core/config.js'
esriConfig.assetsPath = './assets'
esriConfig.fontsUrl = './assets/Fonts/'
esriConfig.geometryServiceUrl ='http://192.168.3.156:6080//arcgis/rest/services/Utilities/Geometry/GeometryServer'
页面测试
helloworld.vue
<template><div class="hello"><div id="map" class="map" v-show="flag == 'map'"></div><div id="earth" class="map" v-show="flag == 'earth'"></div></div>
</template><script>
import Map from '@arcgis/core/Map'
import MapView from '@arcgis/core/views/MapView'
import MapImageLayer from '@arcgis/core/layers/MapImageLayer'
import ElevationLayer from '@arcgis/core/layers/ElevationLayer'
import BaseElevationLayer from '@arcgis/core/layers/BaseElevationLayer'
import SpatialReference from '@arcgis/core/geometry/SpatialReference'
import SceneView from '@arcgis/core/views/SceneView'
import Basemap from '@arcgis/core/Basemap'
import TileLayer from '@arcgis/core/layers/TileLayer'export default {name: 'HelloWorld',data() {return {mapView: null,map: null,map3d: null,flag: 'earth'}},mounted() {this.initBasemap()},methods: {initBasemap() {const self = this//二维const mapImageLayer = new MapImageLayer({url: "http://192.168.3.156:6080/arcgis/rest/services/xiangyang/jichang/MapServer"})this.map = new Map({// basemap: basemap,layers: [mapImageLayer]})this.mapView = new MapView({container: 'map',map: self.map,spatialReference: new SpatialReference({wkid: 3857}),rotation: 41.2,zoom: 3})// 三维地形const ExaggeratedElevationLayer = BaseElevationLayer.createSubclass({      properties: {exaggeration: 10},load: function () {// TopoBathy3D contains elevation values for both land and ocean groundthis._elevation = new ElevationLayer({url: "https://elevation3d.arcgis.com/arcgis/rest/services/WorldElevation3D/TopoBathy3D/ImageServer"});this.addResolvingPromise(this._elevation.load().then(() => {this.tileInfo = this._elevation.tileInfo;this.spatialReference = this._elevation.spatialReference;this.fullExtent = this._elevation.fullExtent;}));return this;},// Fetches the tile(s) visible in the viewfetchTile: function (level, row, col, options) {// calls fetchTile() on the elevationlayer for the tiles// visible in the viewreturn this._elevation.fetchTile(level, row, col, options).then(function (data) {const exaggeration = this.exaggeration;for (let i = 0; i < data.values.length; i++) {// Multiply the given pixel value// by the exaggeration valuedata.values[i] = data.values[i] * exaggeration;}return data;}.bind(this));}});const basemap = new Basemap({baseLayers: [new TileLayer({url: "https://services.arcgisonline.com/ArcGIS/rest/services/World_Imagery/MapServer"}),new TileLayer({url:"https://tiles.arcgis.com/tiles/nGt4QxSblgDfeJn9/arcgis/rest/services/terrain_with_heavy_bathymetry/MapServer"}),]});const elevationLayer = new ExaggeratedElevationLayer();this.map3d = new Map({basemap: basemap,ground: {layers: [elevationLayer]}});const view = new SceneView({container: "earth",map: this.map3d,alphaCompositingEnabled: true,qualityProfile: "high",camera: {position: [-55.039, 14.948, 19921223.3],heading: 2.03,tilt: 0.13},environment: {background: {type: "color",color: [255, 252, 244, 0]},starsEnabled: true,atmosphereEnabled: true,lighting: {type: "virtual"}},});this.map3d.ground = {layers: [elevationLayer]};}}
}
</script><!-- Add "scoped" attribute to limit CSS to this component only -->
<style scoped>
.hello {width: 100%;height: 100%;
}.map {width: 100%;height: 100%;
}
</style>
demo地址
https://gitee.com/wolf_pro/vue_arcgis4.22.git
vue+arcgis 使用esri-loader方式
环境搭建
部署api
从esri deverlopers官网下载api(需要申请账号,有时候还需要翻墙,很麻烦。小编把4.22,4.23.)
为了节省大家时间,小编已经帮各位大人下载,传送门
nginx.conf
server{listen 8082;server_name localhost;root /home/arcgisjs/arcgis_js_v422_api/;location / {#允许跨域请求的域,* 代表所有add_header 'Access-Control-Allow-Origin' *;#允许带上cookie请求add_header 'Access-Control-Allow-Credentials' 'true';#允许请求的方法,比如 GET/POST/PUT/DELETEadd_header 'Access-Control-Allow-Methods' *;#允许请求的headeradd_header 'Access-Control-Allow-Headers' *;index install.html;}}注意跨域访问就行
新建vue项目
废话不多说,我这里建的vue2
安装包
npm install --save esri-loader
地图
main.js
import { loadScript, loadCss } from 'esri-loader'loadCss("http://192.168.3.156:8082/arcgis_js_api/javascript/4.22/esri/themes/light/main.css")
loadScript({dojoConfig: {async: true},url: "http://192.168.3.156:8082/arcgis_js_api/javascript/4.22/init.js"
})
MapContainer
<template><div class="container"><div class="map" id="map"></div><div class="btn-draw" @click="drawPoint"></div></div>
</template><script>
import { loadModules } from 'esri-loader'
export default {data() {return {map: null,mapView: null,draw: null,drawaction: null,pointLayer: null};},mounted() {this.initMap()},beforeDestroy() {this.draw.complete()this.draw = nullthis.drawaction.on('click', null)},methods: {initMap() {let self = this;loadModules(['esri/Map','esri/views/MapView','esri/layers/MapImageLayer','esri/geometry/SpatialReference',"esri/views/draw/Draw","esri/layers/GraphicsLayer",'esri/geometry/Extent',"esri/config"]).then(([Map, MapView, MapImageLayer, SpatialReference,Draw,GraphicsLayer, Extent,esriConfig]) => {esriConfig.fontsUrl ="http://192.168.3.156:8082/fonts/"const layer = new MapImageLayer({url:'http://39.98.44.28:6080/arcgis/rest/services/xiangyangjichang/weijie20230309/MapServer'});self.map = new Map({layers: [layer]});self.mapView = new MapView({container: 'map', // Reference to the scene div created in step 5map: self.map, // Reference to the map object created before the scenespatialReference: new SpatialReference({wkid: 3857}),rotation: 41.2,constraints: {minScale: 600000000, // 视图最小比例尺maxScale: 1130, // 视图最大比例尺rotationEnabled: false // 去掉鼠标右键旋转}});self.mapView.extent = self.extent = new Extent({xmin: 12103840.013011543,ymin: 4086439.3018860994,xmax: 12110502.944852674,ymax: 4090051.894284931,spatialReference: new SpatialReference({wkid: 3857})})self.mapView.ui._removeComponents(['zoom']) // 隐藏放大缩小按钮// 清楚默认的地图放大缩小的比例self.mapView.ui.remove('zoom')self.mapView.ui.remove('attribution')self.draw =  new Draw({view: self.mapView})self.pointLayer = new GraphicsLayer({id: 'pointlayer'})self.map.layers.push(self.pointLayer)}).catch(err => {console.error(err);});},drawPoint() {let self = thisloadModules(["esri/Graphic","esri/layers/GraphicsLayer","esri/views/draw/Draw","esri/config"]).then(([Graphic, GraphicsLayer, Draw,esriConfig]) => {esriConfig.fontsUrl ="http://192.168.3.156:8082/fonts/"if (!self.pointLayer) {self.pointLayer = new GraphicsLayer({id: 'pointlayer'})self.map.layers.push(self.pointLayer)}if (!self.draw) {self.draw =  new Draw({view: self.mapView})}self.drawaction = self.draw.create('point', {mode: 'click'})self.drawaction.on(['draw-complete'], function (event) {if (event.type === 'draw-complete') {const point = {type: 'point',x: event.coordinates[0],y: event.coordinates[1],spatialReference: self.mapView.spatialReference}const markerSymbol = {type: 'simple-marker',color: [255, 0, 0],outline: {color: [255, 255, 255],width: 2}}const inputPoint = new Graphic({geometry: point,symbol: markerSymbol})self.pointLayer.add(inputPoint)const textPoint = {type: 'point',x: event.coordinates[0],y: event.coordinates[1] + 20,spatialReference: self.mapView.spatialReference}const textSymbol = {type: 'text',color: 'rgb(235, 41, 75)',text: "这是一个点",font: {//这个属性一定要设置要不然会从sans-serif这个路径下查找文件family: 'Arial Unicode MS', weight: 'bold',size: '12px'}}const textInfo = new Graphic({geometry: textPoint,symbol: textSymbol})self.pointLayer.add(textInfo)}})})}}
}
</script><style scoped>
.container {width: 100%;height: 100%;
}.map {width: 100%;height: 100%;background-color: rgb(34 50 74);
}.btn-draw {position: absolute;width: 40px;height: 40px;right: 20px;bottom: 20px;background: url(../assets/addc_point.png) no-repeat;cursor: pointer;
}.esri-view-surface--inset-outline:focus::after {outline: none !important;
}
</style>
这篇关于Vue+ ArcGIS JavaScript APi 4.22的文章就介绍到这儿,希望我们推荐的文章对编程师们有所帮助!


