本文主要是介绍普罗米修斯配置部署,希望对大家解决编程问题提供一定的参考价值,需要的开发者们随着小编来一起学习吧!
简介
Prometheus(普罗米修斯)是一套开源的监控&报警&时间序列数据库的组合,由 SoundCloud 公司开发。
Prometheus 基本原理是通过 HTTP 协议周期性抓取被监控组件的状态,这样做的好处是任意组件只要提供 HTTP 接口就可以接入监控系统,不需要任何 SDK 或者其他的集成过程。这样做非常适合虚拟化环境比如 VM 或者 Docker 。
Prometheus 应该是为数不多的适合 Docker、Mesos、Kubernetes 环境的监控系统之一。
Prometheus断电重启后没有数据
cd /usr/local/Prometheus
删掉data下今天最近的数据,然后重启Prometheus
报警参考博客
https://www.cnblogs.com/alamZ/p/16813459.html
Prometheus 优势
易于管理:
Prometheus核心部分只有一个单独的二进制文件,不存在任何的第三方依赖(数据库,缓存等等);
唯一需要的就是本地磁盘,因此不会有潜在级联故障的风险。
强大的查询语言 PromQL:
Prometheus 内置一个强大的数据查询语言 PromQL,通过 PromQL 可以实现对监控数据的查询、聚合。
同时 PromQL 也被应用于数据可视化(如 Grafana)以及告警中。
高效:
对于监控系统而言,大量的监控任务必然导致有大量的数据产生。而 Prometheus 可以高效的处理这些数据。
可扩展:
Prometheus 支持联邦集群,可以让多个 Prometheus 实例产生一个逻辑集群;
当单实例 Prometheus 处理的任务量过大时,通过使用功能分区(sharding)+ 联邦集群(federation)可以对其进行扩展。
易于集成:
目前官网提供了多种语言的客户端 SDK,基于这些 SDK 可以快速让应用程序纳入到监控系统中,同时还支持与其它的监控系统集成。
可视化:
Prometheus Server 自带一个 UI,通过这个 UI 可以方便对数据进行查询和图形化展示;
同时还可以对接 Grafana 可视化工具展示精美监控指标。
Prometheus 基础架构

text Prometheus:主要是负责存储、抓取、聚合、查询方面。 Alertemanager:主要是负责实现报警功能。 Pushgateway:主要是实现接收有 Client-push 过来的指标数据,在指定的时间间隔,有主程序来抓取。 exporter:主要是负责采集物理机、中间件的信息。
Prometheus 安装
需要配置ntp时间服务
https://blog.wanhebin.com/posts/centos7-configure-ntp-server/
参考
从机器
#!/bin/bash
timzon=`timedatectl | grep "Time zone"|awk '{print $3}'`
if [ $timzon != 'Asia/Shanghai' ];thentimedatectl set-timezone Asia/Shanghaiecho "需要修改时区"
elseecho "时区正常"
fi
yum install -y ntp ntpdate
sed -i.bak 's/^server/#server/' /etc/ntp.conf
sed -i '/#server 3\.centos\.pool\.ntp\.org iburst/a \
server 192.168.5.27 \
restrict 192.168.5.27 nomodify notrap noquery \
server 127.0.0.1 \
fudge 127.0.0.1 stratum 10' /etc/ntp.confsystemctl enable ntpd
systemctl restart ntpd
ntpq -p主机器server 192.168.5.27
restrict 192.168.5.27 nomodify notrap noquery
server 127.0.0.1  #local clock
fudge 127.0.0.1 stratum 10#!/bin/bash
timzon=`timedatectl | grep "Time zone"|awk '{print $3}'`
if [ $timzon != 'Asia/Shanghai' ];thentimedatectl set-timezone Asia/Shanghaiecho "需要修改时区"
elseecho "时区正常"
fi
安装prometheus
[root@prometheus ~]# cd /usr/src/
[root@prometheus src]# ls
[root@prometheus src]# ls
debug  influxdb-1.7.8.x86_64 .rpm  kernels  prometheus-2.37.8.linux-arm64.tar.gz
[root@prometheus ~]# cd /usr/src/
[root@prometheus src]# tar -xf  -C prometheus-2.16.0.linux-amd64.tar.gz /usr/local/
[root@prometheus src]# cd /usr/local/
[root@prometheus local]# mv prometheus-2.16.0.linux-amd64 prometheus
[root@prometheus ~]# useradd -s /sbin/nologin prometheus
[root@prometheus local]# chown -R prometheus:prometheus /usr/local/prometheus/[root@prometheus local]# ls
bin  etc  games  include  lib  lib64  libexec  prometheus  sbin  share  src
[root@prometheus local]# cd /usr/lib/systemd/system
[root@prometheus system]# cp sshd.service promethues.service
[root@prometheus system]# vi promethues.service
[root@prometheus system]# cat promethues.service
[Unit]
Description=promethues
After=network.target[Service]
User=prometheus
Group=prometheus
WorkingDirectory=/usr/local/prometheus
ExecStart=/usr/local/prometheus/prometheus   --web.enable-lifecycle --config.file=/usr/local/prometheus/prometheus.yml[Install][root@prometheus local]# chown -R prometheus.prometheus /usr/local/prometheus/
[root@prometheus local]# systemctl daemon-reload
[root@prometheus local]# systemctl start prometheus
[root@prometheus local]# systemctl status prometheus.service
● prometheus.service - prometheusLoaded: loaded (/usr/lib/systemd/system/prometheus.service; enabled; vendor preset: disabled)Active: active (running) since Tue 2023-06-06 05:29:58 EDT; 7s agoMain PID: 17511 (prometheus)CGroup: /system.slice/prometheus.service└─17511 /usr/local/prometheus/prometheusJun 06 05:29:58 prometheus prometheus[17511]: level=info ts=2023-06-06T09:29:58.909Z caller=main.go:335 vm_limits="(soft=unlimited, h...mited)"
Jun 06 05:29:58 prometheus prometheus[17511]: level=info ts=2023-06-06T09:29:58.910Z caller=main.go:661 msg="Starting TSDB ..."当启动 Prometheus 后,便可以通过 9090 端口来访问 Prometheus 自带的 UI 界面配置文件修改后可以通过接口进行重启,不需要重启整个prometheus
curl -X POST http://192.168.5.6:9090/-/reload

配置后端存储
[root@prometheus src]# yum -y install influxdb-1.7.8.x86_64\ .rpm
[root@prometheus src]# cp  /etc/influxdb/influxdb.conf /etc/influxdb/influxdb.conf.bak //进行备份
[root@prometheus src]# systemctl enable --now influxdb
[root@prometheus src]# systemctl status influxdb
● influxdb.service - InfluxDB is an open-source, distributed, time series databaseLoaded: loaded (/usr/lib/systemd/system/influxdb.service; enabled; vendor preset: disabled)Active: active (running) since Tue 2023-06-06 21:26:49 EDT; 13s agoDocs: https://docs.influxdata.com/influxdb/Main PID: 18040 (influxd)CGroup: /system.slice/influxdb.service└─18040 /usr/bin/influxd -config /etc/influxdb/influxdb.conf
[root@prometheus ~]# inf
influx          influx_inspect  influx_tsm      infocmp         infotocap
influxd         influx_stress   info            infokey
[root@prometheus ~]# influx
Connected to http://localhost:8086 version 1.7.8
InfluxDB shell version: 1.7.8
> create database prometheus;
> show databases;
name: databases
name
----
_internal
prometheus
> exit
//配置 Prometheus 集成 infuxdb
[root@prometheus ~]# vi /usr/local/prometheus/prometheus.yml //在最后添加
remote_write:- url: "http://localhost:8086/api/v1/prom/write?db=prometheus"
remote_read:- url: "http://localhost:8086/api/v1/prom/read?db=prometheus"
[root@prometheus ~]# systemctl restart prometheus //进行重启
从机器配置数据源接入到prometheus
/安装 Node_Exporter
[root@clinent ~]# cd /usr/src/
[root@clinent src]# tar -xf node_exporter-1.5.0.linux-amd64.tar.gz -C /usr/local/
[root@clinent src]# cd /usr/local/
[root@clinent local]# mv node_exporter-1.5.0.linux-amd64 exporter
[root@clinent local]# ls
bin  etc  exporter  games  include  lib  lib64  libexec  sbin  share  src
[root@clinent local]# vi /usr/lib/systemd/system/node_exporter.service
[root@clinent local]# useradd -s /sbin/nologin prometheus# 脚本
#!/bin/bash
echo "获取安装包"
mkdir /home/exporter
scp root@192.168.7.129:/home/node_exporter-0.18.1.linux-amd64.tar.gz /home/exporter
echo "解压安装包"
tar -xvf /home/exporter/node_exporter-0.18.1.linux-amd64.tar.gz -C /home/exporter/ && mv /home/exporter/node_exporter-0.18.1.linux-amd64 /home/exporter/exporter
echo "开始安装tmux"
yum install -y tmux.x86_64
echo "开始通过tmux启动"
cd /home/exporter/exporter/
tmux new-session -d -s exporter "./node_exporter --web.listen-address=:9101"
sleep 3
tmux detach -s exporter#普罗米修斯上配置ip
//修改 Promehtues 配置文件
[root@prometheus ~]# vi /usr/local/prometheus/prometheus.yml //修改为下面配置
- job_name: "client"static_configs:- targets: ["192.168.7.129:9101"]
[root@prometheus ~]# systemctl restart prometheus
192.168.7.129:9101查看ui界面


使用 Prometheus + Grafana 实现可视化界面
//安装 Grafana
[root@granfana src]# yum -y install grafana-enterprise-9.5.0-1.x86_64.rpm
[root@granfana src]# systemctl enable --now grafana-server
Created symlink from /etc/systemd/system/multi-user.target.wants/grafana-server.service to /usr/lib/systemd/system/grafana-server.service.
[root@granfana src]# systemctl status grafana-server
● grafana-server.service - Grafana instanceLoaded: loaded (/usr/lib/systemd/system/grafana-server.service; enabled; vendor preset: disabled)Active: active (running) since Tue 2023-06-06 23:35:46 EDT; 18s agoDocs: http://docs.grafana.orgMain PID: 11668 (grafana)CGroup: /system.slice/grafana-server.service└─11668 /usr/share/grafana/bin/grafana server --config=/etc/grafana/grafana.ini --pidfile=/var/run/grafana/grafana-server.pid --p...//可以通过配置改为部分中文
[root@granfana ~]# vi /usr/share/grafana/conf/defaults.ini
# default_language = en-US //注释这行
default_language = zh-Hans //添加这个
[root@granfana ~]# systemctl restart grafana-server


监控rocketmq
rocketmq-exporter-master.zip
将rocketmq-exporter-master.zip 解压
unzip rocketmq-exporter-master.zip
然后到解压目录下面进行打包
mvn clean install
打包后
cd target/
java -jar rocketmq-exporter-0.0.2-SNAPSHOT-exec.jar修改普罗米修斯配置文件
- job_name: "rocketmq"static_configs:- targets: ["192.168.7.129:5557"]labels:instance: '192.168.7.129:5557'
命令使用
node_exporter
curl 192.168.5.6:9100/metrics
#注释的是解释下面输出数据的介绍
process_max_fds 65535 最大文件句柄数是65535
process_open_fds 8    被打开的文件句柄数是8curl 192.168.5.6:9100/metrics|grep node_cup会出现数据,后面图片是对cpu每个字段的解释
cpu使用率计算(1-((sum(increase(node_cpu{mode="idle"}[1m])) by (instance)) /(sum(increase(node_cpu[1m])) by (instance)))) * 100
(1-((sum(increase(node_cpu{mode="idle"}[1m]))  除去空闲时间cpu使用率计算 =(所有非空闲状态的cpu使用时间总和)/(所有状态cpu时间的总和)


exporter的使用介绍
https://prometheus.io/docs/instrumenting/exporters/
需要这里找对应的exporter的插件
计算函数
increase()   函数
increase函数在promethes中,是用来针对Counter这种持续增长的数值,截取其中一段时间的增量
increase(node_cup[1m])   这样就获取了cpu总使用时间在1分钟内的增量sum()       加合函数
sum(increase(node_cup[1m]))by(instance)
这个函数可以吧sum加合到一起的数值,按照指定的一个方式进行一层拆分,instance代表机器名,按照机器名进行拆分
sum(increase(node_cpu_seconds_total{mode="idle"}[1m])) by(instance)

公式拆分
(1-((sum(increase(node_cpu{mode="idle"}[1m])) by (instance)) /(sum(increase(node_cpu[1m])) by (instance)))) * 100
首先第一步
key: node_cpu是需要使用的key name
第二步
把idle空闲的cpu时间和全部的cpu时间过滤出来
increase(node_cpu{mode="idle"}[1m]) = > 代表空闲cpu1分钟内的增量
increase(node_cpu[1m])              = > 把一分钟的增量的cpu时间给取出来((sum(increase(node_cpu{mode="idle"}[1m])) by (instance)) /(sum(increase(node_cpu[1m])) by (instance))))
获取空闲时间百分比
获取其他cpu使用率
(sum(increase(node_cpu_seconds_total{mode="system"}[1m])) by (instance) / sum(increase(node_cpu_seconds_total[1m])) by (instance))*100
mode="user"用户态的cpu使用率
获取cpu每个状态时间的使用百分比
prometheus命令行格式
count_netstat_wait_connections 不是node_exporter提供的
这个key值是通过自定义,并且使用bash脚本+pushgateway的方法推送到prometheus server 采集类型gauge,类型是随机变化的类型不是一直增长的类型
exported_instance指明被监控服务器
count_netstat_wait_connections{exported_instance="912.168.7.*"}
匹配这个网段所有的count_netstat_wait_connections{exported_instance="912.168.7.*"} > 400 匹配大于400
常用函数
rate函数使用
rate()函数是专门搭配counter类型数据使用的函数
它的功能是按照设置一个时间段,取counter这个时间段中平均每秒的增量[5m]是5秒中一次进行计算
rate(http_requests_total{job="api-server"}[5m])
rate(node_network_receive_bytes_total{instance="192.168.5.110:9101"}[1m])以后再使用counter数据类型的时候,永远记得别的不先做,先加上一个rate()或者increase()使用场景:cpu 内存 硬盘 io 网络流量
increase函数使用
increase函数其实和rate()概念及使用方法非常相似
rate是取一段时间增量的平均每秒增量
increase是取一分钟内的增量
sum函数使用
sum就是取和
sum会把结果集的输出进行总加合
sum()by (cluster_name)
topk()函数使用
定义取前几位的最高值
topk(3,count_netstat_wait_connections)
topk(3,node_filesystem_size_bytes{device="tmpfs",fstype="tmpfs",mountpoint="/run/user/0"})
Gauge类型使用
topk(3,count_netstat_wait_connections)
counter类型使用
topk(3,rate(node_network_recelve_bytes[20m]))图形化意义不大,最好是看数值

count函数使用
找出当前或者历史使用超过200的显示出来
官网函数参考网址
https://prometheus.io/docs/prometheus/latest/querying/functions/
exporter下载位置
https://prometheus.io/download/
Prometheus告警
配置发件人邮箱
rpm -ivh grafana-enterprise-9.5.0-1.x86_64.rpm
vim /etc/grafana/grafana.ini
添加以下内容
[smtp]
enabled = true
host = smtp.qq.com:465
user = 123@qq.com
# If the password contains # or ; you have to wrap it with triple quotes. Ex """#password;"""
password = 1234343
;cert_file =
;key_file =
skip_verify = true
from_address = 123@qq.com
from_name = Grafana
配置发件人
配置好了以后需要test测试是否成功发送邮件


配置报警规则
(sum(increase(node_cpu_seconds_total{instance="192.168.6.6:9101",mode="system"}[1m])) / sum(increase(node_cpu_seconds_total{instance="192.168.6.6:9101"}[1m])))*100
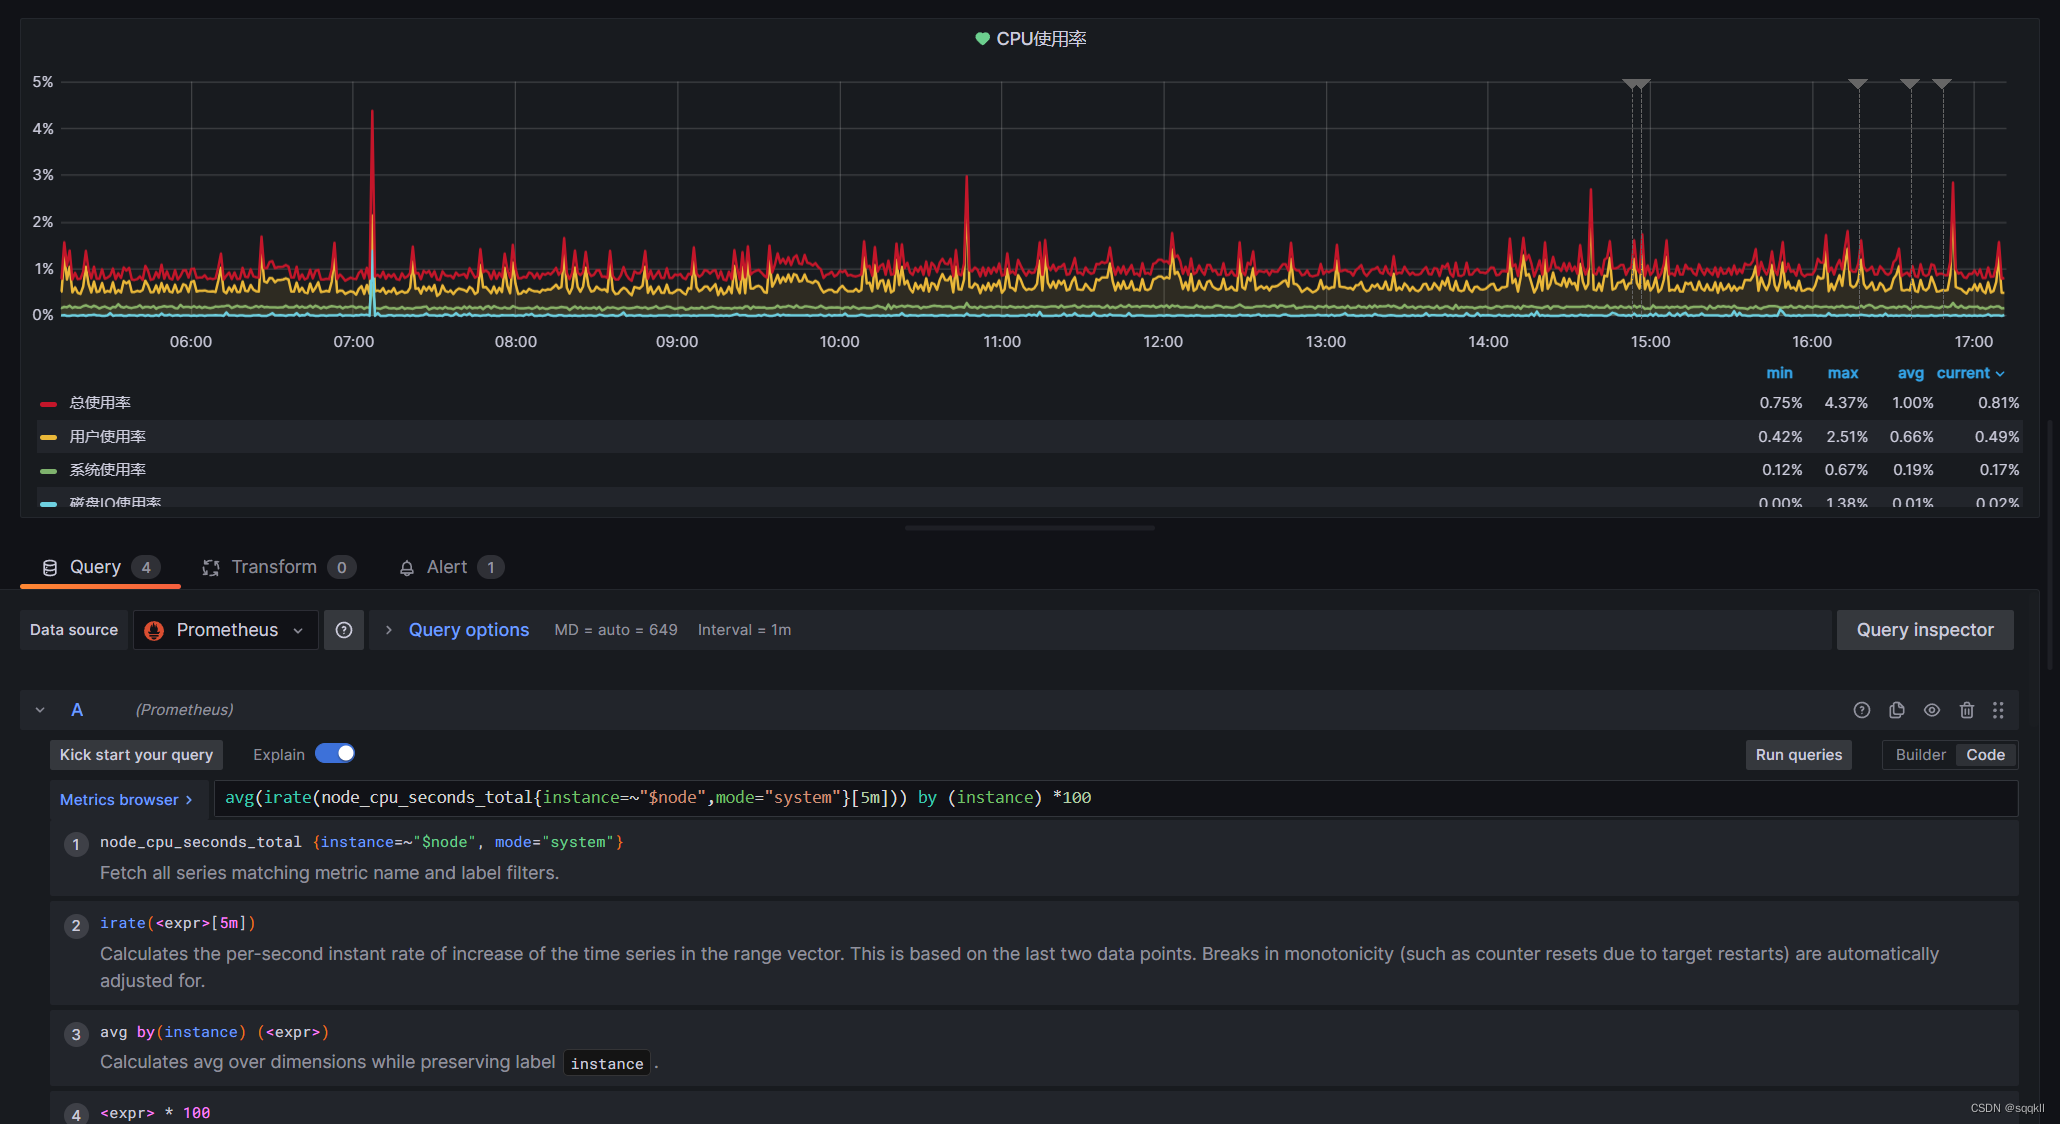
这个需要从仪表盘里面取,然后将这个放到Prometheus查看是否有数据,然后再进行匹配avg(irate(node_cpu_seconds_total{mode="system"}[5m])) by (instance) *100这个是获取所有主机的数据


Alertmanager 报警配置
配置启动文件
alertmanager
vim /usr/lib/systemd/system/alertmanager.service
[Unit]
Description=Alertmanager for prometheus
Documentation=https://prometheus.io/docs/alerting/alertmanager/
[Service]
Restart=always #负责在崩溃后重新恢复服务
ExecStart=/usr/local/alertmanager/alertmanager --config.file=/usr/local/alertmanager/alertmanager.yml --storage.path=/usr/local/alertmanager/data   ## 需要修改安装路径
ExecReload=/bin/kill -HUP $MAINPID #重启参数
TimeoutStopSec=20s
SendSIGKILL=no
[Install]
WantedBy=multi-user.target
prometheus启动文件配置
[Unit]
Description=prometheus
After=network.target[Service]
User=prometheus
Group=prometheus
WorkingDirectory=/usr/local/prometheus
ExecStart=/usr/local/prometheus/prometheus
prometheus配置文件的设定
例子
global:scrape_interval:     15s # 设定抓取数据的周期,默认为1minevaluation_interval: 15s # 设定更新rules文件的周期,默认为1minscrape_timeout: 15s # 设定抓取数据的超时时间,默认为10sexternal_labels: # 额外的属性,会添加到拉取得数据并存到数据库中monitor: 'codelab_monitor'
# Alertmanager配置
alerting:alertmanagers:- static_configs:- targets: ["localhost:9093"] # 设定alertmanager和prometheus交互的接口,即alertmanager监听的ip地址和端口# rule配置,首次读取默认加载,之后根据evaluation_interval设定的周期加载
rule_files:- "alertmanager_rules.yml"- "prometheus_rules.yml"# scape配置
scrape_configs:
- job_name: 'prometheus' # job_name默认写入timeseries的labels中,可以用于查询使用scrape_interval: 15s # 抓取周期,默认采用global配置static_configs: # 静态配置- targets: ['localdns:9090'] # prometheus所要抓取数据的地址,即instance实例项- job_name: 'example-random'static_configs:- targets: ['localhost:8080']
实际配置
global:#设置采集时间间隔scrape_interval: 15s # Set the scrape interval to every 15 seconds. Default is every 1 minute.#监控数据评估evaluation_interval: 15s # Evaluate rules every 15 seconds. The default is every 1 minute.# scrape_timeout is set to the global default (10s).scrape_timeout: 15s # 设定抓取数据的超时时间,默认为10s
# Alertmanager configuration
alerting:alertmanagers:- static_configs:- targets: ["192.168.5.6:9093"]# - alertmanager:9093# Load rules once and periodically evaluate them according to the global 'evaluation_interval'.
rule_files:- "alertmanager_rules.yml"#- "prometheus_rules.yml"# A scrape configuration containing exactly one endpoint to scrape:
# Here it's Prometheus itself.
scrape_configs:# The job name is added as a label `job=<job_name>` to any timeseries scraped from this config.- job_name: "prometheus"# metrics_path defaults to '/metrics'# scheme defaults to 'http'.static_configs:- targets: ["localhost:9090"]- job_name: "client"static_configs:- targets: ["192.168.5.6:9100","192.168.7.129:9100","192.168.5.105:9101","192.168.5.101:9101","192.168.6.6:9101","192.168.5.104:9101","192.168.5.110:9101","192.168.5.103:9101","192.168.5.121:9101","192.168.5.102:9101","192.168.5.112:9101","192.168.5.111:9101","192.168.5.119:9101","192.168.5.118:9101","192.168.5.117:9101","192.168.5.109:9101","192.168.5.108:9101","192.168.5.107:9101","192.168.5.115:9101","192.168.5.114:9101","192.168.5.113:9101","139.199.10.175:9101","192.168.5.24:9101","192.168.5.25:9101"]- job_name: "rocketmq"static_configs:- targets: ["192.168.7.129:5557"]labels:instance: '监控(192.168.7.129:5557)'
remote_write:- url: "http://localhost:8086/api/v1/prom/write?db=prometheus"
remote_read:- url: "http://localhost:8086/api/v1/prom/read?db=prometheus"
检测配置文件是否正常
./promtool check config prometheus.yml
Alertmanager安装配置
启动配置默认配置文件
./alertmanager-config.file= alertmanager.yml #默认配置项为alertmanager.yml
编辑alertmanager.yml配置文件
# 全局变量配置
global:resolve_timeout: 2m #处理超时时间,默认为5minsmtp_smarthost: 'smtp.qq.com:465' # 邮箱smtp服务器代理smtp_from: '153@qq.com' # 发送邮箱名称smtp_auth_username: '15@qq.com' # 邮箱名称smtp_auth_password: 'qonnoz' #邮箱认证码smtp_require_tls: falsesmtp_hello: 'qq.com'
route:group_by: ['alertname']group_wait: 30sgroup_interval: 5mrepeat_interval: 10mreceiver: 'email'
receivers:- name: 'email'email_configs:- to : 's@qi.com'send_resolved: true
inhibit_rules:- source_match:severity: 'critical'target_match:severity: 'warning'equal: ['alertname', 'dev', 'instance']
配置告警规则
groups:- name: testrules:- alert: 分区使用率报警 # 告警名称expr: max((node_filesystem_size_bytes{job=~"client",fstype=~"ext.?|xfs"}-node_filesystem_free_bytes{job=~"client",fstype=~"ext.?|xfs"}) *100/(node_filesystem_avail_bytes {job=~"client",fstype=~"ext.?|xfs"}+(node_filesystem_size_bytes{job=~"client",fstype=~"ext.?|xfs"}-node_filesystem_free_bytes{job=~"client",fstype=~"ext.?|xfs"})))by(instance) >= 80# 告警的判定条件,参考Prometheus高级查询来设定for: 1m # 满足告警条件持续时间多久后,才会发送告警labels: #标签项team: 分区使用率annotations: # 解析项,详细解释告警信息#summary: "分区使用报警"description: "当前已使用: {{$value}}"
启动alertmanager,prometheus
systemctl restart alertmanager.service
systemctl restart promethues.service
Alertmanager 自定义模板配置
配置模板
mkdir alertmanager/templates/
touch wechat.tmpl
vim wechat.tmpl{{ define "wechat.tmpl" }}{{- if gt (len .Alerts.Firing) 0 -}}{{ range .Alerts }}@异常警告 <br>
========start========== <br>实例: {{ .Labels.instance }} <br>信息: {{ .Annotations.summary }} <br>详情: {{ .Annotations.description }} <br>时间: {{ (.StartsAt.Add 28800e9).Format "2006-01-02 15:04:05" }} <br>
========end==========<br>{{ end }}{{ end -}}{{- if gt (len .Alerts.Resolved) 0 -}}{{ range .Alerts }}@异常恢复 <br>
========start========== <br>实例: {{ .Labels.instance }} <br>信息: {{ .Annotations.summary }} <br>时间: {{ (.StartsAt.Add 28800e9).Format "2006-01-02 15:04:05" }} <br>恢复: {{ (.EndsAt.Add 28800e9).Format "2006-01-02 15:04:05" }} <br>
========end==========<br>{{ end }}{{ end -}}{{- end }}
配置文件调用刚刚的模板
vim ../alertmanager/alertmanager.yml
# 全局变量配置
global:resolve_timeout: 2m #处理超时时间,默认为5minsmtp_smarthost: 'smtp.qq.com:465' # 邮箱smtp服务器代理smtp_from: '1234@qq.com' # 发送邮箱名称smtp_auth_username: '1234@qq.com' # 邮箱名称smtp_auth_password: '12345' #邮箱授权密码smtp_require_tls: falsesmtp_hello: 'qq.com'
templates:- './templates/wechat.tmpl'
route:group_by: ['alertname']group_wait: 30sgroup_interval: 40srepeat_interval: 1mreceiver: 'email'
receivers:
- name: 'email'email_configs:- to : '1234.com' #收件人邮箱send_resolved: truehtml: '{{ template "wechat.tmpl" . }}'
inhibit_rules:- source_match:severity: 'critical'target_match:severity: 'warning'equal: ['alertname', 'dev', 'instance']重启服务
systemctl restart alertmanager
systemctl restart prometheus
这篇关于普罗米修斯配置部署的文章就介绍到这儿,希望我们推荐的文章对编程师们有所帮助!


