本文主要是介绍**Vue LeafletJS Maker信息窗口 点线面 卷帘效果**,希望对大家解决编程问题提供一定的参考价值,需要的开发者们随着小编来一起学习吧!
Vue LeafletJS Maker信息窗口 点线面 卷帘效果
Maker信息窗口
1.MakerCmp组件
添加地图注记方法
/*** 添加标记点 图片+文本* @param {*} lng 经度* @param {*} lat 纬度* @param {*} iconurl 图片地址* @param {*} iconwidth 图片宽度* @param {*} iconheight 图片高度* @param {*} label 需要显示的注记,传一个div 可配置样式* @param {*} labelwidth label的最大宽度* @param {*} labelheight label的最大高度* @param {*} labeloffsetx label左右偏移* @param {*} labeloffsety label上下偏移* @param {*} classname 传过来div的class* @param feature*/addbillboard(lng, lat, iconurl, iconwidth, iconheight, label, labelwidth, labelheight, labeloffsetx, labeloffsety, classname,feature) {//单独展示图片 并绑定点击展示的起泡内容 bubble (可以为一个html 或者dom 或者单独的文本)let marker = L.marker([lat, lng], {icon: L.icon({iconUrl: iconurl,iconSize: [iconwidth, iconheight],}),feature:feature}).addTo(this.querygroup).bindPopup('气泡展示')marker.on('click', (e) => {// 图片的点击事件let feature = e.target.options.feature// debugger})//展示文本L.marker([lat, lng], {icon: L.divIcon({html: label,className: classname,iconSize: [labelwidth, labelheight],iconAnchor: [labeloffsetx, labeloffsety]})}).addTo(this.querygroup)}2.调用方法
this.addbillboard(112.9, 28.68, require('@/assets/sign113.png'), 80, 80, `<div style="border-radius: 5px;background-color: #0b88e9ba;padding: 3px;text-align: center;" class='leaflet-label'>标记点</div>`, 45, 20, 22, 45, "leaflet-marker",'frature')2.Vue父组件使用
<MakerCmp :data="data"></MakerCmp>3.MakerCmp组件使用
props: {data: {type: Object,default: ()=>{}}}循环调用方法
for (var i of data){addbillboardbeidou(JSON.stringify(i),i.lng, i.lat, i.img, 45, 45, `<div class='leaflet-label'>${i.name}</div>`, 200, 20, 100, 45, "leaflet-marker")}完整代码
<template><div><div id="map"></div></div>
</template><script>
export default {data() {return {map: "",querygroup:null};},mounted() {//地图初始化this.initDate();//循环调用此方法this.addbillboard(112.9, 28.68, require('@/assets/sign113.png'), 80, 80, `<div style="border-radius: 5px;background-color: #0b88e9ba;padding: 3px;text-align: center;" class='leaflet-label'>标记点</div>`, 45, 20, 22, 45, "leaflet-marker",'frature')},methods: {initDate() {this.map = L.map("map", {center: [27.68, 112],zoom: 6.5,maxZoom: 20,minZoom: 5,attributionControl: false, // 移除右下角leaflet标识zoomControl: false,///编辑插件editable: true,crs: L.CRS.EPSG4326,});var tiandituimg = L.tileLayer("http://t1.tianditu.com/img_c/wmts?layer=img&style=default&tilematrixset=c&Service=WMTS&Request=GetTile&Version=1.0.0&Format=tiles&TileMatrix={z}&TileCol={x}&TileRow={y}&tk=6c6c18e4ec555ea8f0976ec71960021f",{maxNativeZoom: 17,maxZoom: 23,tileSize: 256,zoomOffset: 1,}).addTo(this.map);var tianditucia = L.tileLayer("http://t1.tianditu.com/cia_c/wmts?layer=cia&style=default&tilematrixset=c&Service=WMTS&Request=GetTile&Version=1.0.0&Format=tiles&TileMatrix={z}&TileCol={x}&TileRow={y}&tk=6c6c18e4ec555ea8f0976ec71960021f",{maxNativeZoom: 17,maxZoom: 23,tileSize: 256,zoomOffset: 1,}).addTo(this.map).setZIndex(10);this.querygroup = L.layerGroup().addTo(this.map)},/*** 添加标记点 图片+文本* @param {*} lng  经度* @param {*} lat  纬度* @param {*} iconurl  图片地址* @param {*} iconwidth 图片宽度* @param {*} iconheight  图片高度* @param {*} label  需要显示的注记,传一个div 可配置样式* @param {*} labelwidth  label的最大宽度* @param {*} labelheight  label的最大高度* @param {*} labeloffsetx  label左右偏移* @param {*} labeloffsety  label上下偏移* @param {*} classname  传过来div的class* @param feature*/addbillboard(lng, lat, iconurl, iconwidth, iconheight, label, labelwidth, labelheight, labeloffsetx, labeloffsety, classname,feature) {//单独展示图片 并绑定点击展示的起泡内容  bubble (可以为一个html 或者dom  或者单独的文本)let marker = L.marker([lat, lng], {icon: L.icon({iconUrl: iconurl,iconSize: [iconwidth, iconheight],}),feature:feature}).addTo(this.querygroup).bindPopup('气泡展示')marker.on('click', (e) => {//   图片的点击事件let feature = e.target.options.feature// debugger})//展示文本L.marker([lat, lng], {icon: L.divIcon({html: label,className: classname,iconSize: [labelwidth, labelheight],iconAnchor: [labeloffsetx, labeloffsety]})}).addTo(this.querygroup)}}
};
</script><style  scoped>
#map {width: 100%;height: calc(100vh);z-index: 1;
}
.leaflet-label {border-radius: 5px;background-color: #0b88e9ba;padding: 3px;text-align: center;
}
.leaflet-marker {color: antiquewhite;
}
.sideMap{position: absolute;top: 20px;left: 20px;z-index: 9999;
}
</style>
点线面手动绘制操作
1.添加点方法
addOpint(){this.map.on('click', (evt) => {console.log(evt.latlng)let opint =evt.latlngthis.addbillboard(opint.lng, opint.lat, require('@/assets/sign113.png'), 80, 80, `<div class='leaflet-fly'>ces </div>`, 55, 20, 28, 45, "leaflet-marker",name)})},2.添加线方法
addLine(){this.flyroad = null//定义点组和线let points = []this.map.on('click', (evt) => {points.push(evt.latlng)//其他的则直接添加this.map.on('mousemove', mousemove);//因为会移动let that =thisfunction mousemove(e) {points.push(e.latlng)if (that.flyroad) that.map.removeLayer(that.flyroad)that.flyroad = L.polyline(points, {color: '#00CED1',})that.flyroad.addTo(that.querygroup)points.pop()}that.map.on('dblclick', (e) => {console.log(e)if (that.flyroad) that.map.removeLayer(that.flyroad)//是否要中间线that.flyroad.addTo(that.querygroup)that.map.off('click').off('mousemove').off('dblclick');})})},3.添加面方法
addPolygon(){let points = [], drawpolygonthis.map.on('click', (evt) => {points.push(evt.latlng)//移动线this.map.on('mousemove', (e) => {points.push(e.latlng)if (drawpolygon) this.map.removeLayer(drawpolygon)drawpolygon = L.polygon(points, {color: '#00CED1',fillColor: '#000000',fillOpacity: 0.3})drawpolygon.addTo(this.querygroup)points.pop()})this.map.on('dblclick', (e) => {if (drawpolygon) this.map.removeLayer(drawpolygon)drawpolygon.addTo(this.querygroup)this.map.off('click').off('mousemove').off('dblclick');//执行查询功能})})},线面显示操作
线数据显示
let points= [] //经纬度 [27.68, 112]
polyline = L.polyline(points, {color: '#00CED1',}).addTo(querygroup);
面数据显示
let aa= [] //经纬度 [27.68, 112]
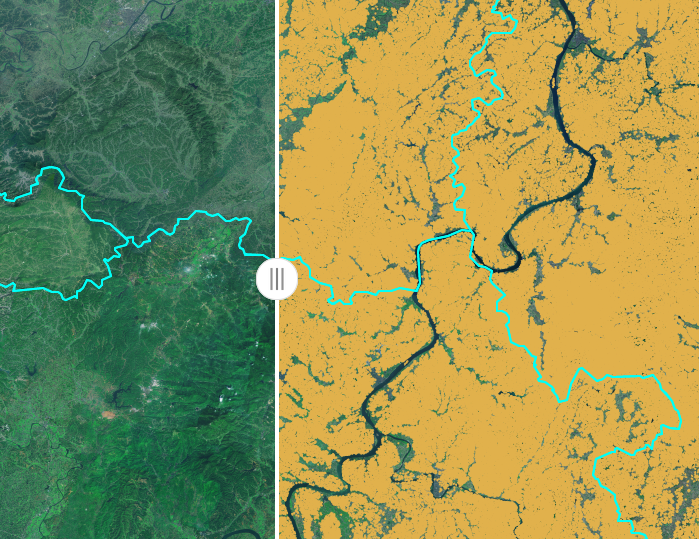
polygon = L.polygon(points, {color: '#00CED1',fillColor: '#000000',fillOpacity: 0.3}).addTo(querygroup);卷帘效果
npm 安装 npm install leaflet-side-by-side --save
在main.js中引入 import 'leaflet-side-by-side'
//addTileMap()方法为调取图层方法
function sideBySide() {let mapleft = addTileMap("http://222.244.103.77:8081/hnlydsj/tsc/img-server/v1?layer=WXYGYX_XQ_1M_2021&Tilematrix={z}&Tilecol={x}&TileRow={y}", '湖南卫星地图', '分屏加载')let mapright = addTileMap(" http://222.244.103.77:8081/hnlydsj/tsc/mapeditor/mapserver/layer/WMTS/1.0/2013年湖南二调小班/默认/getTile/{z}/{y}/{x}", '2013年森林资源二调数据', '分屏加载')side = L.control.sideBySide(mapleft, mapright).addTo(map);
}let Tilemap = [], sidemap = [] //存储已经添加的图层
function addTileMap(mapurl, mapname, addtype) {let addmap = L.tileLayer(mapurl,{maxNativeZoom: 17,maxZoom: 23,tileSize: 256,zoomOffset: 1,}).addTo(map);if (addtype == '地图加载') {Tilemap.push({ name: mapname, layer: addmap });} else {sidemap.push({ name: mapname, layer: addmap });}return addmap
}
这篇关于**Vue LeafletJS Maker信息窗口 点线面 卷帘效果**的文章就介绍到这儿,希望我们推荐的文章对编程师们有所帮助!


