本文主要是介绍SpringCloud 断路器监控HystrixDashboard与Turbine Hoxton版本,希望对大家解决编程问题提供一定的参考价值,需要的开发者们随着小编来一起学习吧!
Spring Cloud Hystrix Dashboard简介:Hystrix Dashboard是Spring Cloud中监控Hystrix执行情况的仪表盘组件,支持单实例监控和集群监控。
Spring Cloud Turbine简介:Spring Cloud Turbine是一个Hystrix聚合监控组件,将多个服务的Hystrix Dashboard数据进行聚合监控。
本文主要对Spring Cloud Hystrix Dashboard和Spring Cloud Turbine的基本使用进行简单总结,其中SpringBoot使用的2.2.2.RELEASE版本,SpringCloud使用的Hoxton.SR1版本。这里将沿用SpringCloud 服务注册与发现Eureka Hoxton版本的eureka-server作为注册中心,eureka-client作为服务生产者。
一、Hystrix单实例监控
首先通过使用Hystrix Dashboard监控单个Hystrix实例,通过Maven新建一个名为spring-cloud-netflix-hystrix-dashboard的项目。
1.引入依赖
SpringBoot和SpringCloud依赖这里就不列出来了,还需引入以下依赖:
<!-- Spring Cloud Eureka Client 起步依赖 -->
<dependency><groupId>org.springframework.cloud</groupId><artifactId>spring-cloud-starter-netflix-eureka-client</artifactId>
</dependency>
<!-- Spring Cloud Hystrix DashBoard 起步依赖 -->
<dependency><groupId>org.springframework.cloud</groupId><artifactId>spring-cloud-starter-netflix-hystrix-dashboard</artifactId>
</dependency>
<!-- Actuator 起步依赖 -->
<dependency><groupId>org.springframework.boot</groupId><artifactId>spring-boot-starter-actuator</artifactId>
</dependency>
2.主启动类
package com.rtxtitanv;import org.springframework.boot.SpringApplication;
import org.springframework.boot.autoconfigure.SpringBootApplication;
import org.springframework.cloud.netflix.eureka.EnableEurekaClient;
import org.springframework.cloud.netflix.hystrix.dashboard.EnableHystrixDashboard;/*** @author rtxtitanv* @version 1.0.0* @name com.rtxtitanv.HystrixDashboardApplication* @description 主启动类* @date 2020/2/27 17:19*/
@EnableHystrixDashboard
@EnableEurekaClient
@SpringBootApplication
public class HystrixDashboardApplication {public static void main(String[] args) {SpringApplication.run(HystrixDashboardApplication.class, args);}
}
@EnableHystrixDashboard:启用Hystrix监控。
3.编写配置文件
在application.yml中进行如下配置:
server:port: ${PORT:1200}spring:application:name: hystrix-dashboardeureka:client:# 服务注册,是否将服务注册到Eureka注册中心,true:注册,false:不注册register-with-eureka: true# 服务发现,是否从Eureka注册中心获取注册信息,true:获取,false:不获取fetch-registry: true# 配置Eureka注册中心即Eureka服务端的地址,集群地址以,隔开service-url:defaultZone: http://rtxtitanv:rtxtitanv@eureka-server-01:8001/eureka/,http://rtxtitanv:rtxtitanv@eureka-server-02:8002/eureka/,http://rtxtitanv:rtxtitanv@eureka-server-03:8003/eureka/instance:# 将ip地址注册到Eureka注册中心prefer-ip-address: true# 该服务实例在注册中心的唯一实例ID,${spring.cloud.client.ip-address}获取该服务实例ipinstance-id: ${spring.application.name}:${spring.cloud.client.ip-address}:${server.port}# 该服务实例向注册中心发送心跳间隔,单位秒,默认30秒lease-renewal-interval-in-seconds: 20# Eureka注册中心在删除此实例之前收到最后一次心跳后的等待时间,单位秒,默认90秒lease-expiration-duration-in-seconds: 60
4.暴露被监控服务的hystrix.stream端点
新建两个被监控的服务hystrix-monitored,openfeign-monitored,其中hystrix-monitored是ribbon中使用hystrix,openfeign-monitored是openfeign中使用hystrix,创建过程这里就省略了,想要用于被监控,还需要引入以下依赖:
<!-- Spring Cloud Hystrix 起步依赖 -->
<dependency><groupId>org.springframework.cloud</groupId><artifactId>spring-cloud-starter-netflix-hystrix</artifactId>
</dependency>
<!-- Actuator 起步依赖 -->
<dependency><groupId>org.springframework.boot</groupId><artifactId>spring-boot-starter-actuator</artifactId>
</dependency>
然后在application.yml中添加以下配置,暴露hystrix.stream端点:
management:endpoints:web:exposure:# 暴露指定端点,hystrix.stream为hystrix监控端点,'*'暴露所有端点include: 'hystrix.stream'
openfeign-monitored主启动类上也需要添加@EnableHystrix注解。
5.单实例监控
IDEA启动eureka-server集群,eureka-client集群,hystrix-monitored,openfeign-monitored和hystrix-dashboard,其中eureka-client共3个节点,hystrix-monitored端口为9350,openfeign-monitored端口为9250,访问http://localhost:1200/hystrix,进入Hystrix Dashboard面板页面:

在地址框中输入hystrix-monitored实例的监控地址后点击监控按钮:

然后不断访问http://localhost:9350/hystrix,监控信息见下图:

在地址框中输入openfeign-monitored实例的监控地址后点击监控按钮:

然后不断访问http://localhost:9250/openfeign,监控信息见下图:

二、Hystrix默认集群监控
这里使用Turbine来聚合hystrix-monitored服务和openfeign-monitored服务的监控信息,先使用默认的集群监控方式,通过Maven新建一个名为spring-cloud-netflix-turbine的项目。
1.引入依赖
SpringBoot和SpringCloud依赖这里就不列出来了,还需引入以下依赖:
<!-- Spring Cloud Eureka Client 起步依赖 -->
<dependency><groupId>org.springframework.cloud</groupId><artifactId>spring-cloud-starter-netflix-eureka-client</artifactId>
</dependency>
<!-- Spring Cloud Turbine 起步依赖 -->
<dependency><groupId>org.springframework.cloud</groupId><artifactId>spring-cloud-starter-netflix-turbine</artifactId>
</dependency>
<!-- Actuator 起步依赖 -->
<dependency><groupId>org.springframework.boot</groupId><artifactId>spring-boot-starter-actuator</artifactId>
</dependency>
2.主启动类
package com.rtxtitanv;import org.springframework.boot.SpringApplication;
import org.springframework.boot.autoconfigure.SpringBootApplication;
import org.springframework.cloud.netflix.eureka.EnableEurekaClient;
import org.springframework.cloud.netflix.turbine.EnableTurbine;/*** @author rtxtitanv* @version 1.0.0* @name com.rtxtitanv.TurbineApplication* @description 主启动类* @date 2020/2/27 17:56*/
@EnableTurbine
@EnableEurekaClient
@SpringBootApplication
public class TurbineApplication {public static void main(String[] args) {SpringApplication.run(TurbineApplication.class, args);}
}
@EnableTurbine:启用Turbine聚合监控。
3.编写配置文件
在application.yml中进行如下配置:
server:port: ${PORT:1300}spring:application:name: turbineeureka:client:# 服务注册,是否将服务注册到Eureka注册中心,true:注册,false:不注册register-with-eureka: true# 服务发现,是否从Eureka注册中心获取注册信息,true:获取,false:不获取fetch-registry: true# 配置Eureka注册中心即Eureka服务端的地址,集群地址以,隔开service-url:defaultZone: http://rtxtitanv:rtxtitanv@eureka-server-01:8001/eureka/,http://rtxtitanv:rtxtitanv@eureka-server-02:8002/eureka/,http://rtxtitanv:rtxtitanv@eureka-server-03:8003/eureka/instance:# 将ip地址注册到Eureka注册中心prefer-ip-address: true# 该服务实例在注册中心的唯一实例ID,${spring.cloud.client.ip-address}获取该服务实例ipinstance-id: ${spring.application.name}:${spring.cloud.client.ip-address}:${server.port}# 该服务实例向注册中心发送心跳间隔,单位秒,默认30秒lease-renewal-interval-in-seconds: 20# Eureka注册中心在删除此实例之前收到最后一次心跳后的等待时间,单位秒,默认90秒lease-expiration-duration-in-seconds: 60# 默认集群监控
turbine:# 需要聚合监控的服务名称,多个以,号分隔app-config: hystrix-monitored,openfeign-monitoredaggregator:# 需要聚合监控的集群名称,多个以,隔开,默认defaultcluster-config: default# 指定集群表达式名称cluster-name-expression: new String("default")# 是否以主机名和端口号区分服务,true:是,false:否# 默认情况下会以host来区分不同的服务,在本机调试的时本机上不同的服务会聚合成一个服务来统计combine-host-port: true
4.默认集群监控
IDEA启动eureka-server集群,eureka-client集群,hystrix-monitored集群,openfeign-monitored集群,hystrix-dashboard和turbine,其中eureka-client,hystrix-monitored,openfeign-monitored都是3个节点,hystrix-monitored集群节点端口分别为9351,9352,9353,openfeign-monitored集群节点端口分别为9251,9252,9253,访问http://localhost:1200/hystrix,在地址框中输入默认集群监控地址后点击监控按钮:

然后不断访问http://localhost:9351/hystrix,http://localhost:9352/hystrix,http://localhost:9353/hystrix,http://localhost:9251/openfeign,http://localhost:9252/openfeign,http://localhost:9253/openfeign,默认的集群监控信息见下图:

三、Hystrix指定集群监控
下面使用Turbine进行指定的集群监控。
1.集群分组
在hystrix-monitored服务的application.yml中新增以下配置:
eureka:instance:# 自定义元数据metadata-map:# 用于Turbine聚合监控的集群名cluster: HYSTRIX
这里将服务名改为动态传入,便于之后测试,测试时会启动hystrix-monitored和hystrix-monitored2两个服务,修改如下:
spring:application:name: ${APP_NAME:hystrix-monitored}
在openfeign-monitored服务的application.yml中新增以下配置:
eureka:instance:# 自定义元数据metadata-map:# 用于Turbine聚合监控的集群名cluster: OPENFEIGN
这里将服务名改为动态传入,便于之后测试,测试时会启动openfeign-monitored和openfeign-monitored2两个服务,修改如下:
spring:application:name: ${APP_NAME:openfeign-monitored}
2.修改turbine服务配置
在turbine服务的application.yml中修改以下配置:
# 指定集群监控
turbine:# 需要聚合监控的服务名称,多个以,号分隔app-config: hystrix-monitored,openfeign-monitored,hystrix-monitored2,openfeign-monitored2aggregator:# 需要聚合监控的集群名称,多个以,隔开,默认defaultcluster-config: HYSTRIX,OPENFEIGN# 指定集群表达式名称cluster-name-expression: metadata['cluster']# 是否以主机名和端口号区分服务,true:是,false:否# 默认情况下会以host来区分不同的服务,在本机调试的时本机上不同的服务会聚合成一个服务来统计combine-host-port: true# 被监控服务都没配置context-path需配置为/actuator/hystrix.stream# 被监控服务都配置相同context-path情况需配置为 此处为配置的context-path/actuator/hystrix.streaminstanceUrlSuffix: /actuator/hystrix.stream
3.指定集群监控
IDEA启动eureka-server集群,eureka-client集群,hystrix-monitored集群,hystrix-monitored2集群,openfeign-monitored集群,openfeign-monitored2集群,hystrix-dashboard和turbine,访问注册中心,下图为服务注册信息:

访问http://localhost:1200/hystrix,在地址框中输入需要Turbine聚合监控的HYSTRIX集群的监控地址后点击监控按钮:

然后不断访问http://localhost:9351/hystrix,http://localhost:9352/hystrix,http://localhost:9354/hystrix,http://localhost:9355/hystrix,HYSTRIX集群的监控信息见下图:

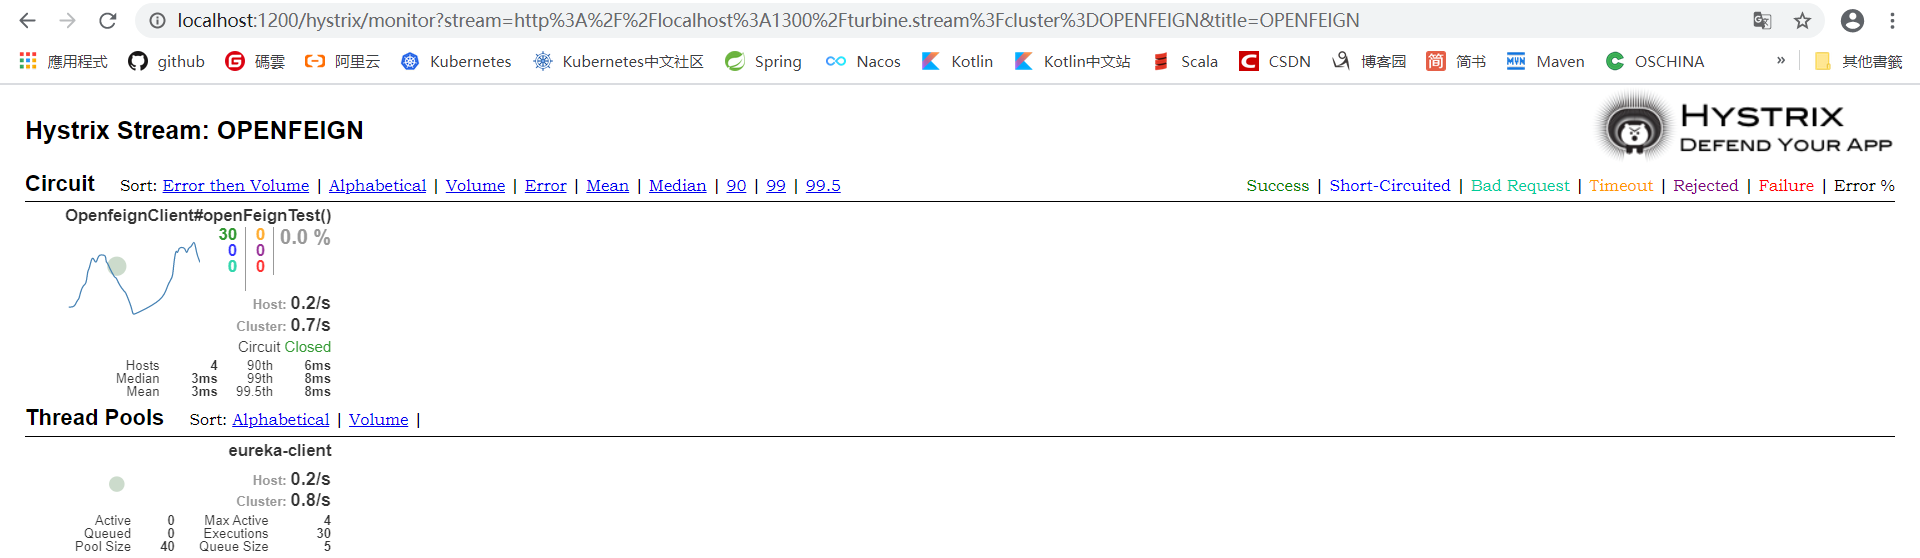
访问http://localhost:1200/hystrix,在地址框中输入需要Turbine聚合监控的OPENFEIGN集群的监控地址后点击监控按钮:

然后不断访问http://localhost:9251/openfeign,http://localhost:9252/openfeign,http://localhost:9254/openfeign,http://localhost:9255/openfeign,OPENFEIGN集群的监控信息见下图:

四、解决服务配置context-path后Turbine聚合监控不到信息问题
1.被监控服务都配置相同context-path
这里使用默认的集群监控方式来测试,在被监控服务的application.yml中都新增以下context-path配置:
server:servlet:# 被监控服务都配置相同context-path情况context-path: /common
IDEA启动eureka-server集群,eureka-client集群,hystrix-monitored集群,openfeign-monitored集群,hystrix-dashboard和turbine,访问注册中心,下图为服务注册信息:

访问http://localhost:1200/hystrix,输入http://localhost:1300/turbine.stream,点击Monitor Stream,再访问两个被监控服务的接口http://localhost:9351/common/hystrix,http://localhost:9252/common/openfeign,9352和9251的链接这里省略,结果监控不到信息,见下图:

访问http://localhost:9351/common/actuator/hystrix.stream,产生了数据,见下图:

为了解决这个问题,需要在turbine服务的application.yml中新增以下配置:
turbine:# 被监控服务都配置相同context-path情况,common为配置的context-path# 被监控服务都没配置context-path需省略该配置instanceUrlSuffix: common/actuator/hystrix.stream
然后重启turbine,重新访问http://localhost:1200/hystrix,输入http://localhost:1300/turbine.stream,点击Monitor Stream,然后访问两个被监控服务接口,已经监控到了信息,监控信息见下图:

2.被监控服务配置了不同context-path
如果被监控服务配置了不同context-path,就需要根据context-path进行分组,将配置有相同context-path的服务分为一组。这里使用指定的集群监控方式来测试,配置见上文指定集群监控。
在hystrix-monitored和hystrix-monitored2服务的application.yml中新增以下context-path配置:
server:servlet:# 被监控服务配置了不同context-path情况context-path: /hystrix
在openfeign-monitored和openfeign-monitored2服务的application.yml中新增以下context-path配置:
server:servlet:# 被监控服务配置了不同context-path情况context-path: /openfeign
然后在turbine服务的application.yml中修改以下配置:
turbine:# 被监控服务配置了不同context-path或被监控服务部分配置了context-path# 根据context-path进行分组,将配置有相同context-path的服务分为一组instanceUrlSuffix:# 相同context-path服务分为的集群对应的instanceUrlSuffix# 如果有部分服务没有配置context-path,对该部分服务分组后无需配置对应的instanceUrlSuffix,为默认值/actuator/hystrix.streamHYSTRIX: hystrix/actuator/hystrix.streamOPENFEIGN: openfeign/actuator/hystrix.stream
IDEA启动eureka-server集群,eureka-client集群,hystrix-monitored集群,hystrix-monitored2集群,openfeign-monitored集群,openfeign-monitored2集群,hystrix-dashboard和turbine,访问注册中心,下图为服务注册信息:

访问http://localhost:1200/hystrix,输入http://localhost:1300/turbine.stream?cluster=HYSTRIX,点击Monitor Stream,然后不断访问http://localhost:9351/hystrix/hystrix,http://localhost:9352/hystrix/hystrix,http://localhost:9354/hystrix/hystrix,http://localhost:9355/hystrix/hystrix,HYSTRIX集群的监控信息见下图:

访问http://localhost:1200/hystrix,输入http://localhost:1300/turbine.stream?cluster=OPENFEIGN,点击Monitor Stream,然后不断访问http://localhost:9251/openfeign/openfeign,http://localhost:9252/openfeign/openfeign,http://localhost:9254/openfeign/openfeign,http://localhost:9255/openfeign/openfeign,OPENFEIGN集群的监控信息见下图:

3.被监控服务部分配置了context-path
如果被监控服务只有部分配置了context-path,有一部分没配置context-path,可以将没配置context-path的服务分成一组或多组,不过这部分服务分组后无需配置对应的instanceUrlSuffix。下面进行测试,将openfeign-monitored和openfeign-monitored2服务的application.yml中的context-path配置暂时注释掉,然后在turbine服务的application.yml中修改以下配置:
turbine:# 被监控服务配置了不同context-path或被监控服务部分配置了context-path# 根据context-path进行分组,将配置有相同context-path的服务分为一组instanceUrlSuffix:# 相同context-path服务分为的集群对应的instanceUrlSuffix# 如果有部分服务没有配置context-path,对该部分服务分组后无需配置对应的instanceUrlSuffix,为默认值/actuator/hystrix.streamHYSTRIX: hystrix/actuator/hystrix.stream
IDEA启动eureka-server集群,eureka-client集群,hystrix-monitored集群,hystrix-monitored2集群,openfeign-monitored集群,openfeign-monitored2集群,hystrix-dashboard和turbine,访问注册中心,下图为服务注册信息:

访问http://localhost:1200/hystrix,输入http://localhost:1300/turbine.stream?cluster=HYSTRIX,点击Monitor Stream,然后不断访问http://localhost:9351/hystrix/hystrix,http://localhost:9352/hystrix/hystrix,http://localhost:9354/hystrix/hystrix,http://localhost:9355/hystrix/hystrix,HYSTRIX集群的监控信息见下图:

访问http://localhost:1200/hystrix,输入http://localhost:1300/turbine.stream?cluster=OPENFEIGN,点击Monitor Stream,然后不断访问http://localhost:9251/openfeign,http://localhost:9252/openfeign,http://localhost:9254/openfeign,http://localhost:9255/openfeign,OPENFEIGN集群的监控信息见下图:
代码示例
- Github:
https://github.com/RtxTitanV/springcloud-learning/tree/master/springcloud-hoxton-learning/spring-cloud-netflix-hystrix-dashboard
https://github.com/RtxTitanV/springcloud-learning/tree/master/springcloud-hoxton-learning/spring-cloud-netflix-turbine
https://github.com/RtxTitanV/springcloud-learning/tree/master/springcloud-hoxton-learning/spring-cloud-netflix-hystrix-monitored
https://github.com/RtxTitanV/springcloud-learning/tree/master/springcloud-hoxton-learning/spring-cloud-openfeign-monitored - Gitee:
https://gitee.com/RtxTitanV/springcloud-learning/tree/master/springcloud-hoxton-learning/spring-cloud-netflix-hystrix-dashboard
https://gitee.com/RtxTitanV/springcloud-learning/tree/master/springcloud-hoxton-learning/spring-cloud-netflix-turbine
https://gitee.com/RtxTitanV/springcloud-learning/tree/master/springcloud-hoxton-learning/spring-cloud-netflix-hystrix-monitored
https://gitee.com/RtxTitanV/springcloud-learning/tree/master/springcloud-hoxton-learning/spring-cloud-openfeign-monitored
这篇关于SpringCloud 断路器监控HystrixDashboard与Turbine Hoxton版本的文章就介绍到这儿,希望我们推荐的文章对编程师们有所帮助!


