本文主要是介绍R-散点图,希望对大家解决编程问题提供一定的参考价值,需要的开发者们随着小编来一起学习吧!
> x1=round(rnorm(10,mean=77,sd=9))
> x2=round(rnorm(10,mean=85,sd=20))
> plot(x1,x2)
如下图

> plot(x1,x2,main = "analysis",xlab = "mathermatical analysis",ylab="linear algebra",xlim = c(0,100),ylim = c(0,100),xaxs="i" ,# Set axis style as internalyaxs="i", # Set y axis style as internal col="red",# Set the color of plotting symbol to red pch=19)# Set the plotting symbol to filled dots

连线图
> a=c(2,3,4,5,6)
> b=c(4,7,8,9,12)
> plot(a,b,type="l")
多条曲线的效果
> tokyo=round(rnorm(10,mean=200,sd=50))
> tokyo[1] 144 191 231 152 140 281 240 137[9] 182 133> newwork=round(rnorm(10,mean=80,sd=10))
> newwork[1] 77 81 68 80 70 76 76 83 88 66> lines(newwork,type="l",col="blue",lwd=2)
> longdon=round(rnorm(10,mean=50,sd=10))
> lines(longdon,type="l",col="blue",lwd=2)
## 向日葵散点图 ##
用来克服散点图中数据点重叠问题
在有重叠的地方用一朵“向日葵花”的花瓣数目来表示重叠数据的个数
> sunflowerplot(iris[,3:4],col="gold",seg.col="gold")
散点图集
- 便利样本中全部的变量配对画出二元图
直观地了解所有变量之间的关系
pairs(iris[,1:4])

散点图集
- 用plot 也可以实现同样的效果
> plot(iris[,1:4],main="Relaationships between",pch=19,col="blue",cex=0.9)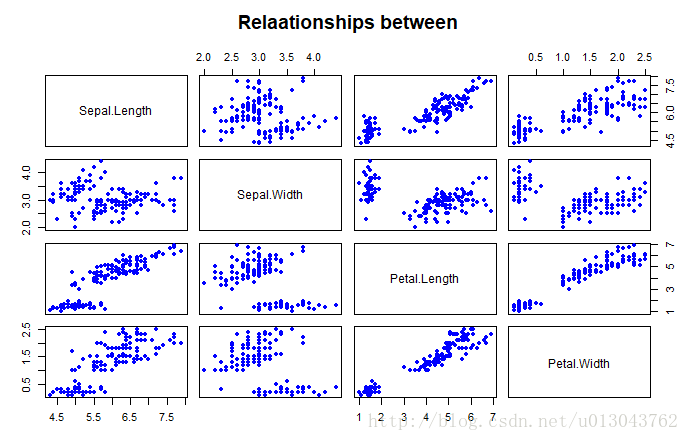 - 利用par()在同一个device 输出多个散点图
Par 命令博大精深,用于设置绘图参数,Help(par)
关于绘图参数
help(par)
colors()
绘图设备

dev.cur()
dev.list()
dev.next(which=dev.cur())
dev.prev(which=dev.cur())
dev.off(which=dev.cur())
dev.set(which=dev.next())
dev.new(…)
graphics.off()
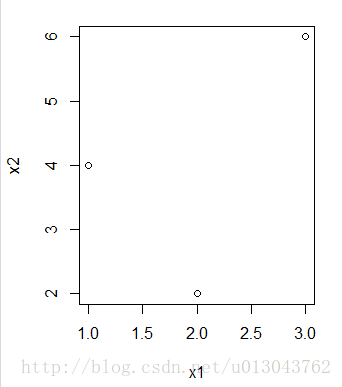
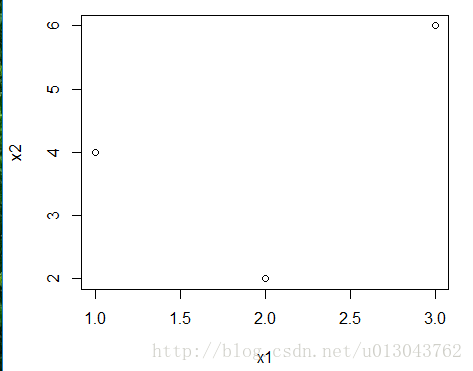
x1=c(1:3)
x1
[1] 1 2 3
x2=c(4,2,6)
x2
[1] 4 2 6
plot(x1,x2)
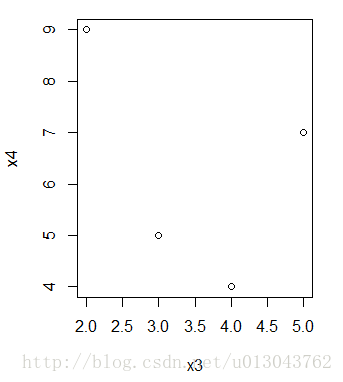
x3=c(3,4,2,5)
x4=c(5,4,9,7)
plot(x3,x4)
dev.new()
NULL
plot(x1,x2)
dev.list()
RStudioGD png windows
2 3 4
dev.cur()
windows
4
dev.next()
RStudioGD
2
dev.cur()
windows
4
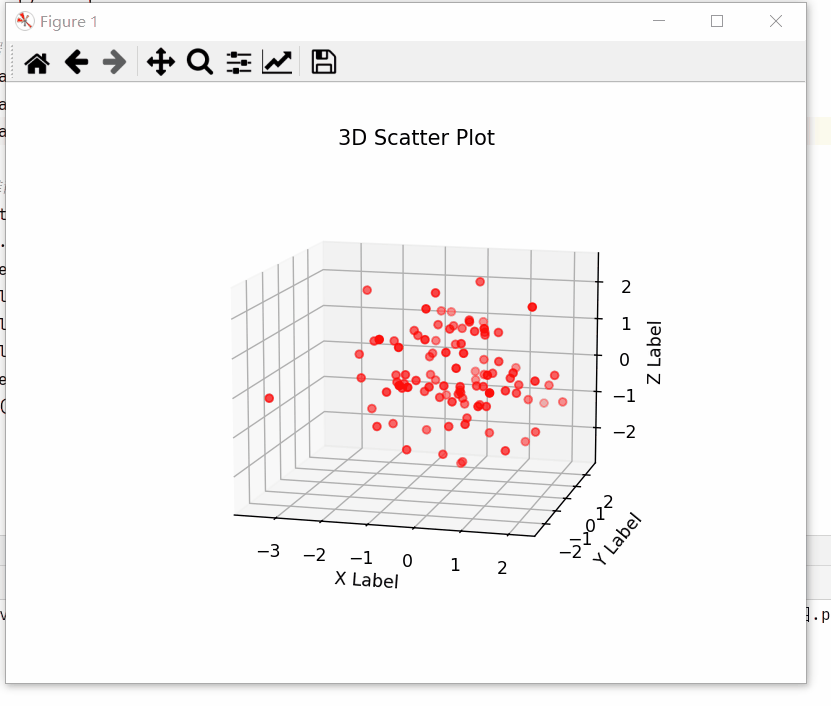
**三维散点图**
**安装工具包**
install.packages(“scatterplot3d”)
Installing package into ‘C:/Users/nanji/Documents/R/win-library/3.0’
(as ‘lib’ is unspecified)
有二进制版本(将被安装),但源代码版本是后来的:
binary source
scatterplot3d 0.3-35 0.3-40
trying URL ‘https://cran.rstudio.com/bin/windows/contrib/3.0/scatterplot3d_0.3-35.zip’
Content type ‘application/zip’ length 289696 bytes (282 Kb)
opened URL
downloaded 282 Kb
package ‘scatterplot3d’ successfully unpacked and MD5 sums checked
The downloaded binary packages are in
C:\Users\nanji\AppData\Local\Temp\RtmpEJLAN9\downloaded_packages
scatterplot3d(iris[2:4])
Error: could not find function “scatterplot3d”
scatterplot3d::scatterplot3d(iris[2:4])
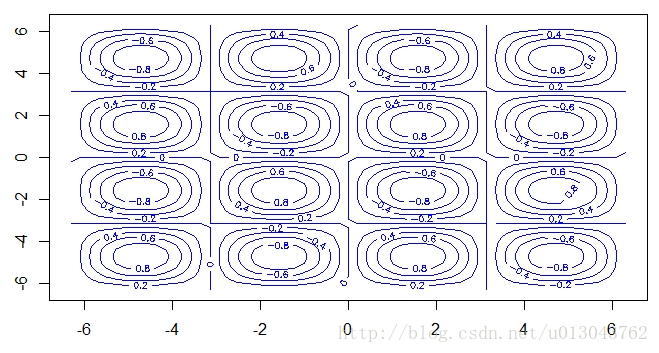
x<-y<-seq(-2*pi,2*pi,pi/15)
f<-function(x,y)sin(x)*sin(y)
z<-outer(x,y,f)
contour(x,y,z,col=”blue”)
persp(x,y,z,theta=30,phi=30,expand=0.7,col=”lightblue”)
“`

这篇关于R-散点图的文章就介绍到这儿,希望我们推荐的文章对编程师们有所帮助!