本文主要是介绍Linux系统命令traceroute详解(语法、选项、原理和实例),希望对大家解决编程问题提供一定的参考价值,需要的开发者们随着小编来一起学习吧!
目录
一、traceroute概述
二、语法
1、基本语法
2、命令选项
三、帮助信息
四、示例
1. 使用默认模式(ICMP Echo)追踪到目标主机
2. 使用UDP模式(需要root权限)追踪到目标主机
3. 不解析IP地址为主机名,直接显示IP地址
4. 探测包使用UDP,端口设置为6888
5. 设置查询次数为n次
6、跳数设置为m次
五、输出结果解释
六、工作原理
七、Traceroute的安装
八、使用traceroute的注意事项
一、traceroute概述
在Linux系统下,traceroute是一个网络诊断工具,用于追踪一个数据包从源点到目的地所经过的路由路径。它通过向目的地发送一系列的 UDP 或 ICMP 数据包,并记录每个数据包所经过的路由器,来显示数据包到达目的地的路径。
二、语法
1、基本语法
traceroute的基本语法如下:
traceroute [选项] 目标主机
其中,
[选项] 是可选的参数,用于定制traceroute的行为;
目标主机 可以是目标主机的域名或IP地址。
2、命令选项
Traceroute常用选项如下:
-I:使用ICMP Echo模式发送数据包。这是traceroute命令的默认模式。
-U:使用UDP模式发送数据包。该模式下的traceroute命令需要以root权限运行。
-T:使用TCP模式发送数据包。同样,该模式下的traceroute命令需要以root权限运行。
-n:不要解析IP地址为主机名,以IP地址形式显示主机名。
-s 源地址:指定源地址,可以是主机名或IP地址。
-p 端口号:指定源端口,以查找防火墙规则或过滤器的规则对目标主机的响应是否过滤。默认端口号通常为33434(UDP模式)。
-q 查询次数:设置查询次数,默认值为3。每次查询会增加TTL值,直到到达目标主机或达到最大的TTL值。
-m 跳数:设置最大的TTL值,默认值为30。该值指定了数据包能经过的最大路由器数量。当数据包的TTL值达到该值时,数据包会被丢弃。
-w 等待时间:指定每个数据包的超时时间。
三、帮助信息
在linux的命令行输入
traceroute --help
结果如下:
[root@localhost ~]# traceroute  --help
Usage:traceroute [ -46dFITnreAUDV ] [ -f first_ttl ] [ -g gate,... ] [ -i device ] [ -m max_ttl ] [ -N squeries ] [ -p port ] [ -t tos ] [ -l flow_label ] [ -w waittime ] [ -q nqueries ] [ -s src_addr ] [ -z sendwait ] [ --fwmark=num ] host [ packetlen ]
Options:-4                          Use IPv4-6                          Use IPv6-d  --debug                 Enable socket level debugging-F  --dont-fragment         Do not fragment packets-f first_ttl  --first=first_ttlStart from the first_ttl hop (instead from 1)-g gate,...  --gateway=gate,...Route packets through the specified gateway(maximum 8 for IPv4 and 127 for IPv6)-I  --icmp                  Use ICMP ECHO for tracerouting-T  --tcp                   Use TCP SYN for tracerouting (default port is 80)-i device  --interface=deviceSpecify a network interface to operate with-m max_ttl  --max-hops=max_ttlSet the max number of hops (max TTL to bereached). Default is 30-N squeries  --sim-queries=squeriesSet the number of probes to be triedsimultaneously (default is 16)-n                          Do not resolve IP addresses to their domain names-p port  --port=port        Set the destination port to use. It is eitherinitial udp port value for "default" method(incremented by each probe, default is 33434), orinitial seq for "icmp" (incremented as well,default from 1), or some constant destinationport for other methods (with default of 80 for"tcp", 53 for "udp", etc.)-t tos  --tos=tos           Set the TOS (IPv4 type of service) or TC (IPv6traffic class) value for outgoing packets-l flow_label  --flowlabel=flow_labelUse specified flow_label for IPv6 packets-w waittime  --wait=waittimeSet the number of seconds to wait for response toa probe (default is 5.0). Non-integer (floatpoint) values allowed too-q nqueries  --queries=nqueriesSet the number of probes per each hop. Default is3-r                          Bypass the normal routing and send directly to ahost on an attached network-s src_addr  --source=src_addrUse source src_addr for outgoing packets-z sendwait  --sendwait=sendwaitMinimal time interval between probes (default 0).If the value is more than 10, then it specifies anumber in milliseconds, else it is a number ofseconds (float point values allowed too)-e  --extensions            Show ICMP extensions (if present), including MPLS-A  --as-path-lookups       Perform AS path lookups in routing registries andprint results directly after the correspondingaddresses-M name  --module=name      Use specified module (either builtin or external)for traceroute operations. Most methods havetheir shortcuts (`-I' means `-M icmp' etc.)-O OPTS,...  --options=OPTS,...Use module-specific option OPTS for thetraceroute module. Several OPTS allowed,separated by comma. If OPTS is "help", print infoabout available options--sport=num                 Use source port num for outgoing packets. Implies`-N 1'--fwmark=num                Set firewall mark for outgoing packets-U  --udp                   Use UDP to particular port for tracerouting(instead of increasing the port per each probe),default port is 53-UL                         Use UDPLITE for tracerouting (default dest portis 53)-D  --dccp                  Use DCCP Request for tracerouting (default portis 33434)-P prot  --protocol=prot    Use raw packet of protocol prot for tracerouting--mtu                       Discover MTU along the path being traced. Implies`-F -N 1'--back                      Guess the number of hops in the backward path andprint if it differs-V  --version               Print version info and exit--help                      Read this help and exitArguments:
+     host          The host to traceroute topacketlen     The full packet length (default is the length of an IPheader plus 40). Can be ignored or increased to a minimalallowed value
[root@localhost ~]#
[root@localhost ~]#
四、示例
1. 使用默认模式(ICMP Echo)追踪到目标主机
traceroute www.vidisit.cn
实际操作如下:
[root@localhost ~]# traceroute vidisit.cn
traceroute to vidisit.cn (118.123.16.102), 30 hops max, 60 byte packets1  gateway (192.168.1.254)  0.563 ms  0.667 ms  0.824 ms2  221.225.102.1 (221.225.102.1)  5.111 ms  5.075 ms  5.067 ms3  141.124.111.202.dial.sz.js.dynamic.163data.com.cn (202.111.124.141)  8.588 ms  8.627 ms  8.651 ms4  222.92.174.181 (222.92.174.181)  9.041 ms  9.085 ms  9.097 ms5  202.97.15.134 (202.97.15.134)  34.176 ms  35.279 ms 202.97.93.102 (202.97.93.102)  32.934 ms6  * * *7  * * *8  * * *9  * * *
10  118.123.16.102 (118.123.16.102)  34.674 ms !X  35.554 ms !X  34.200 ms !X
[root@localhost ~]#
[root@localhost ~]#
2. 使用UDP模式(需要root权限)追踪到目标主机
sudo traceroute -U vidisit.cn
实际操作如下:
[root@localhost ~]# traceroute -U vidisit.cn
traceroute to vidisit.cn (118.123.16.102), 30 hops max, 60 byte packets1  gateway (192.168.1.254)  0.572 ms  0.641 ms  0.789 ms2  221.225.102.1 (221.225.102.1)  5.238 ms  5.261 ms  5.297 ms3  141.124.111.202.dial.sz.js.dynamic.163data.com.cn (202.111.124.141)  9.637 ms  9.673 ms  9.708 ms4  * * *5  202.97.15.134 (202.97.15.134)  34.953 ms * 202.97.15.138 (202.97.15.138)  35.193 ms6  * * *7  * * *8  * * *9  * * *
10  118.123.16.102 (118.123.16.102)  36.319 ms !X  36.426 ms !X  38.104 ms !X
[root@localhost ~]#
3. 不解析IP地址为主机名,直接显示IP地址
命令如下:
traceroute -n www.vidisit.cn
4. 探测包使用UDP,端口设置为6888
命令如下:
traceroute -p 6888 www.vidisit.cn
5. 设置查询次数为n次
也就是把探测包的个数设置为值n,命令如下:
traceroute -q 5 www.example.com
6、跳数设置为m次
命令如下:
traceroute -m 10 www.vidisit.cn
输出如下:
[root@localhost ~]# traceroute -m  5 vidisit.cn
traceroute to vidisit.cn (118.123.16.102), 5 hops max, 60 byte packets1  gateway (192.168.1.254)  0.518 ms  0.666 ms  0.842 ms2  221.225.102.1 (221.225.102.1)  4.837 ms  4.872 ms  4.913 ms3  141.124.111.202.dial.sz.js.dynamic.163data.com.cn (202.111.124.141)  9.723 ms  9.761 ms  9.801 ms4  * * *5  202.97.93.110 (202.97.93.110)  33.380 ms 202.97.15.110 (202.97.15.110)  35.038 ms 202.97.92.250 (202.97.92.250)  34.232 ms
[root@localhost ~]#
五、输出结果解释
traceroute的输出结果通常分为多列,每列代表一个“跳点”(即数据包经过的路由器或主机)。每一行代表一个跳点,通常包括:
(1)跳点的序号(从1开始)。
(2)该跳点的IP地址。
(3)主机名(如果使用了-n选项,则不会显示主机名)。
(4)三个时间值(ms),分别代表三次尝试到达该跳点所需的时间。如果某个时间值为星号,则表示该次尝试超时。
六、工作原理
Traceroute的工作原理主要基于ICMP(Internet Control Message Protocol)和IP头部的TTL(Time To Live)字段。如下图所示:
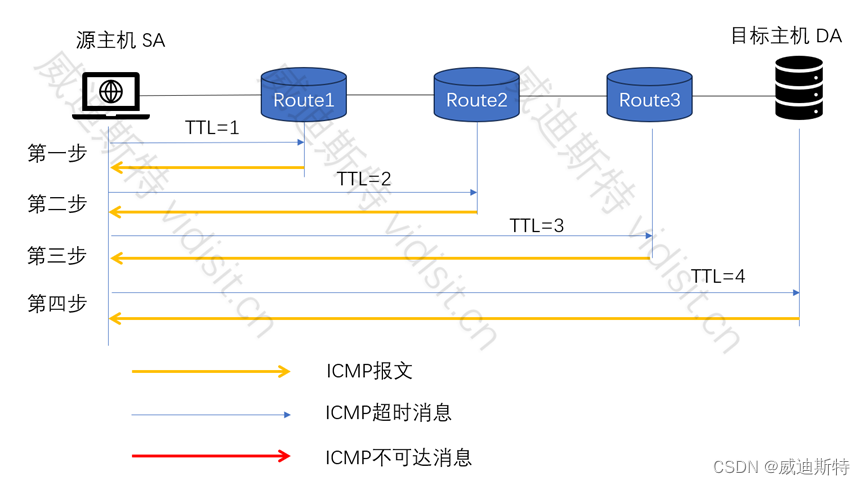
Traceroute通过发送不同TTL值的IP数据包来追踪数据包从源主机(源主机SA)到目的主机(目标主机DA)所经过的路由。
具体来说,第一步,Traceroute首先发送一个TTL为1的IP数据包,这个数据包的TTL每经过一个路由器时减1,直到TTL变为0,此时路由器会将该数据包丢弃并返回一个ICMP超时消息给源主机。Traceroute接收到这个ICMP消息后,就知道该路由器存在于路径上。
接着,第2步,Traceroute会发送下一个TTL为2的IP数据包,以此类推,直到数据包到达目的主机(目标主机DA)。
当数据包到达目的(主机目标主机DA)时,目的主机的操作系统会返回一个ICMP不可达消息,因为目的主机的端口号通常不会用于Traceroute发送的UDP数据包。这样,Traceroute就能知道目的主机已经到达。
此外,Traceroute还可以通过发送UDP数据包来检测目的主机的可达性。这些UDP数据包的端口号通常是一个大于30000的随机值,以避免与常规应用程序的端口冲突。当这些UDP数据包到达目的主机时,目的主机的操作系统会返回一个ICMP不可达消息,表明UDP数据包的目的端口不可达。
Traceroute通过这种方式,可以记录下从源主机到目的主机所经过的每个路由器的IP地址,以及每个路由器处理数据包的时间。这样,用户就可以看到数据包从源到目的地的完整路径。
七、Traceroute的安装
在CentOS系统中,traceroute 通常可以通过包管理器安装。对于大多数CentOS版本,traceroute 可能已经预装,如果没有安装,可以使用 yum 包管理器安装。
sudo yum install traceroute
实际操作如下:
[root@localhost ~]# yum install traceroute
已加载插件:fastestmirror
Determining fastest mirrors
epel/x86_64/metalink                                                                                                                      | 6.2 kB  00:00:00* base: mirrors.ustc.edu.cn* epel: mirrors.tuna.tsinghua.edu.cn* extras: mirrors.nju.edu.cn* updates: mirrors.nju.edu.cn
base                                                                                                                                      | 3.6 kB  00:00:00
epel                                                                                                                                      | 4.3 kB  00:00:00
extras                                                                                                                                    | 2.9 kB  00:00:00
updates                                                                                                                                   | 2.9 kB  00:00:00
(1/4): epel/x86_64/updateinfo                                                                                                             | 1.0 MB  00:00:02
(2/4): updates/7/x86_64/primary_db                                                                                                        |  27 MB  00:00:03
(3/4): epel/x86_64/group                                                                                                                  | 399 kB  00:00:03
(4/4): epel/x86_64/primary_db                                                                                                             | 8.7 MB  00:00:19
正在解决依赖关系
--> 正在检查事务
---> 软件包 traceroute.x86_64.3.2.0.22-2.el7 将被 安装
--> 解决依赖关系完成依赖关系解决=================================================================================================================================================================Package                                 架构                                版本                                        源                                 大小
=================================================================================================================================================================
正在安装:traceroute                              x86_64                              3:2.0.22-2.el7                              base                               59 k事务概要
=================================================================================================================================================================
安装  1 软件包总下载量:59 k
安装大小:92 k
Is this ok [y/d/N]: y
Downloading packages:
traceroute-2.0.22-2.el7.x86_64.rpm                                                                                                        |  59 kB  00:00:00
Running transaction check
Running transaction test
Transaction test succeeded
Running transaction正在安装    : 3:traceroute-2.0.22-2.el7.x86_64                                                                                                             1/1验证中      : 3:traceroute-2.0.22-2.el7.x86_64                                                                                                             1/1已安装:traceroute.x86_64 3:2.0.22-2.el7完毕!
[root@localhost ~]#
[root@localhost ~]#
八、使用traceroute的注意事项
在使用UDP或TCP模式时,traceroute可能会受到防火墙或安全设备的限制,因为这些模式需要发送额外的数据包。
ICMP Echo模式(默认模式)通常较为通用,但也可能在某些情况下受到限制。
在使用traceroute命令时,请确保您有权访问目标主机,并尊重目标主机的网络安全策略。
文章正下方可以看到我的联系方式:鼠标“点击” 下面的 “威迪斯特-就是video system 微信名片”字样,就会出现我的二维码,欢迎沟通探讨。
这篇关于Linux系统命令traceroute详解(语法、选项、原理和实例)的文章就介绍到这儿,希望我们推荐的文章对编程师们有所帮助!


